Interactive Brokers vs Hargreaves Lansdown: Which Platform Is Best for a Self-Directed SIPP?
Interactive Brokers vs Hargreaves Lansdown SIPP
As a GIP investor's portfolio grows, two platforms dominate the conversation: Hargreaves Lansdown and Interactive Brokers.
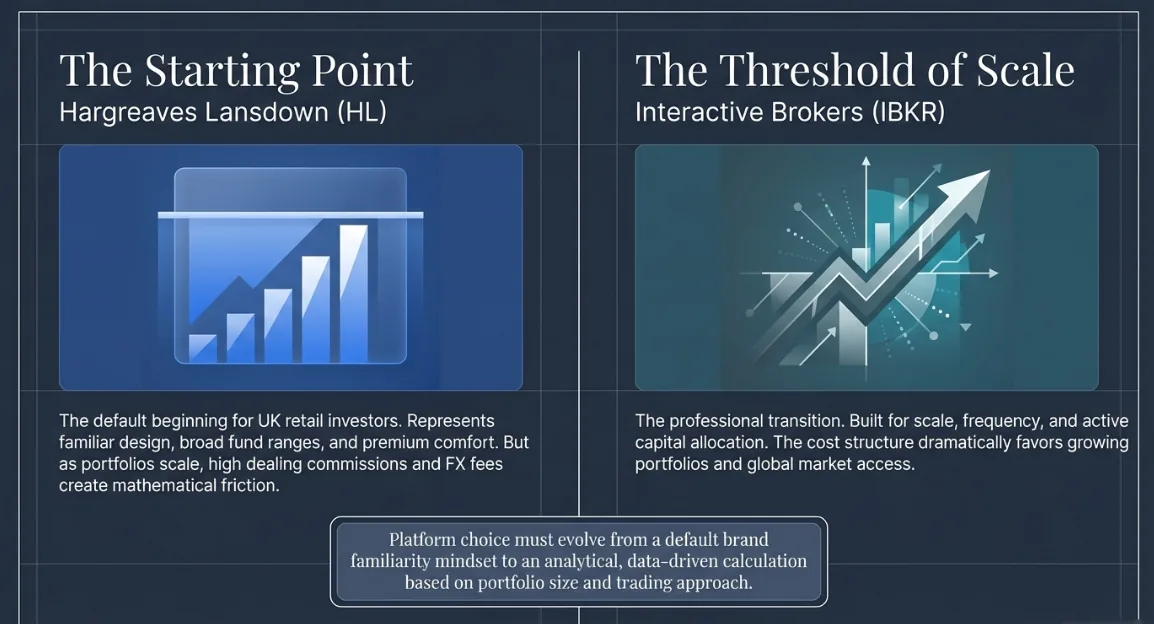
HL is where most self-directed UK investors start. It is familiar, well-designed, and has the broadest fund range of any UK retail platform.
Interactive Brokers (IBKR) is where many of them eventually move or consider moving when they realise that HL's dealing commissions are among the highest in the market and that IBKR's cost structure becomes dramatically more advantageous as portfolio size and trading frequency increase.
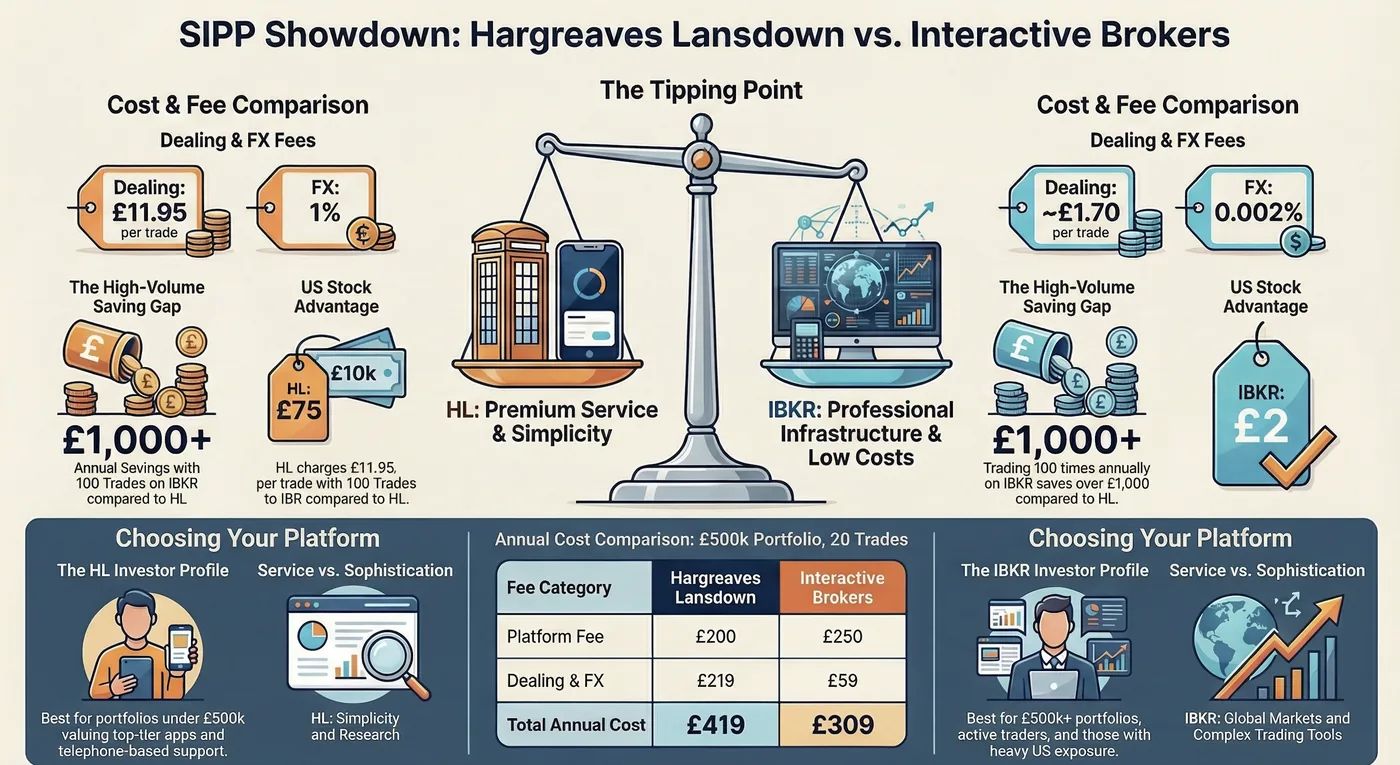
This comparison between Hargreaves Lansdown and Interactive Brokers SIPP gives you the data to make that decision based on your specific portfolio size and trading approach not on brand familiarity.
Alpesh Patel OBE is Founding Principal of Rootbridge Capital, a Bloomberg TV alumnus, Financial Times author, and former Visiting Fellow at Corpus Christi College, Oxford. GIP members use both platforms — this comparison is designed to help them make a data-driven choice.
The Core Difference: Service vs Cost
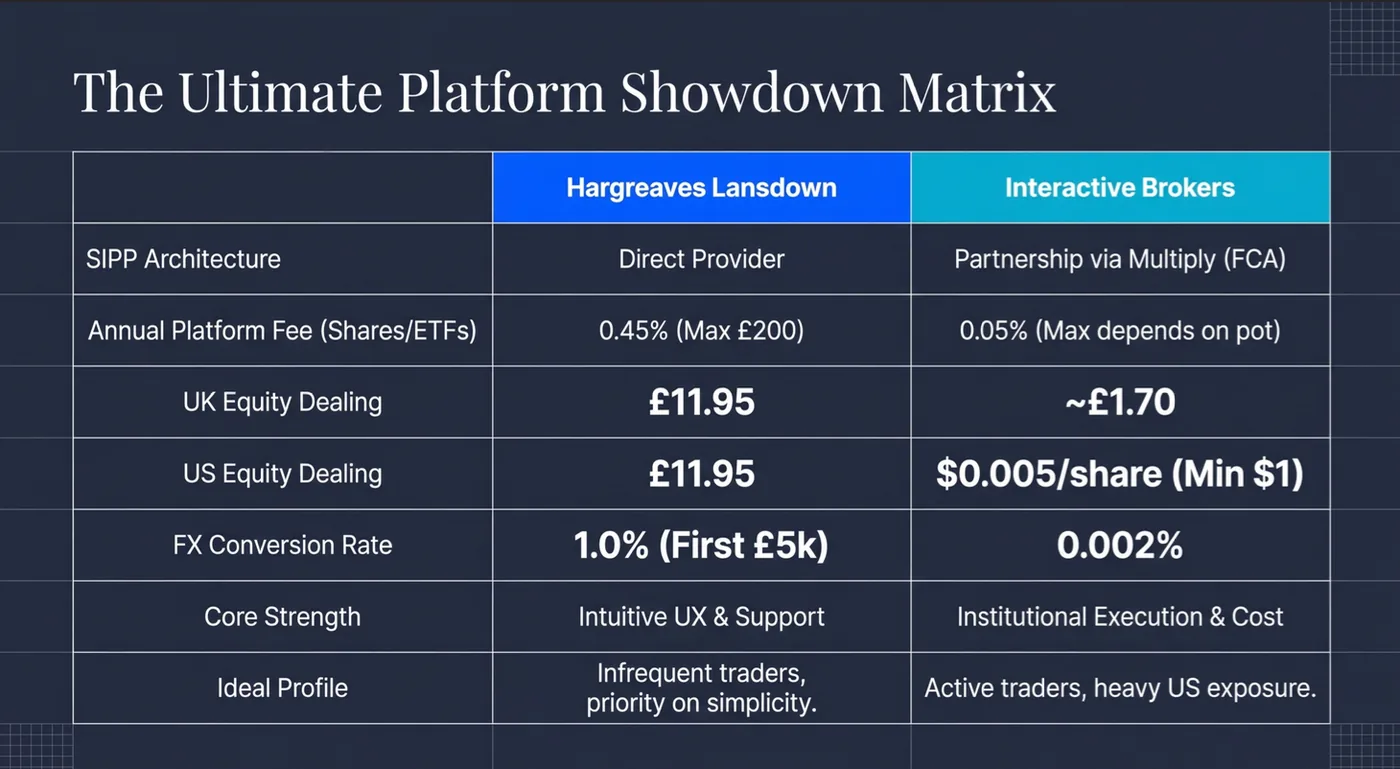
HL and IBKR are optimised for fundamentally different investor profiles. HL is a premium service platform built for UK retail investors who want an excellent interface, strong research tools, outstanding customer support, and access to virtually every UK and international investment in one place.
IBKR is a professional-grade trading infrastructure platform built for active investors who want the lowest possible transaction costs and access to global markets at institutional-quality execution.
Neither is universally better. The right choice depends on your portfolio size, how frequently you trade, and how much you value service quality vs cost minimisation.
Platform Charges: The Direct Comparison
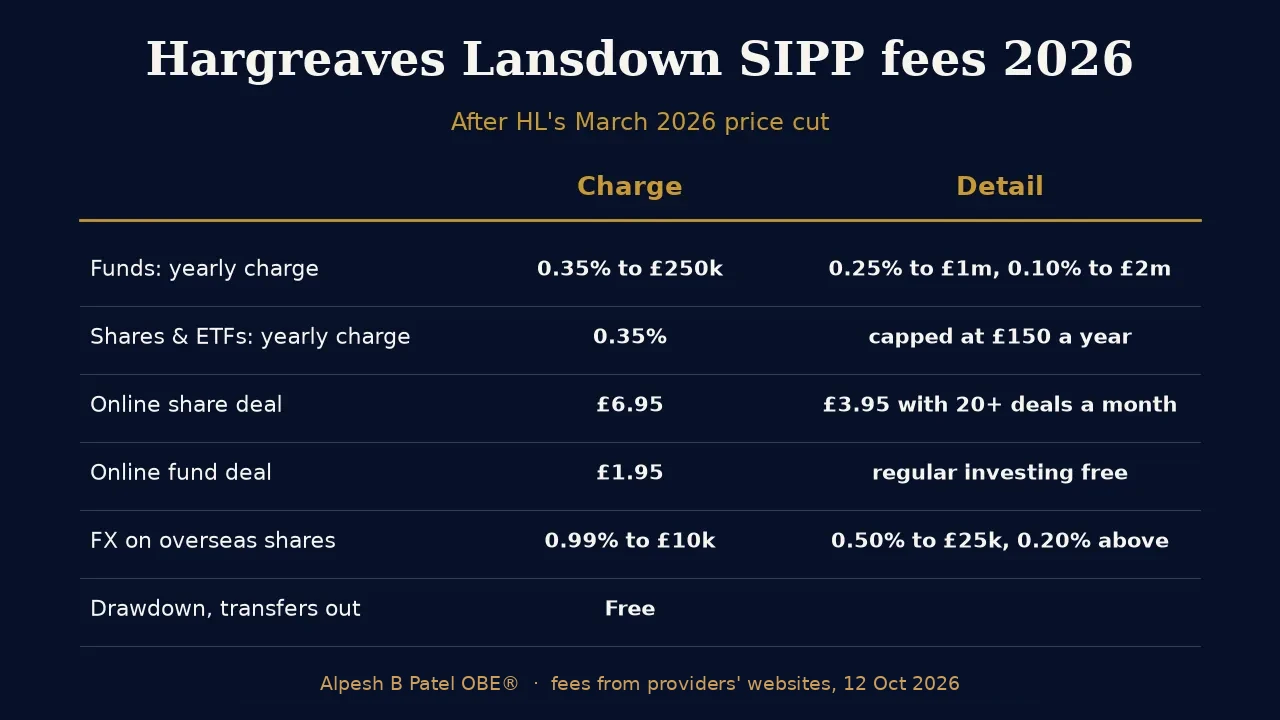
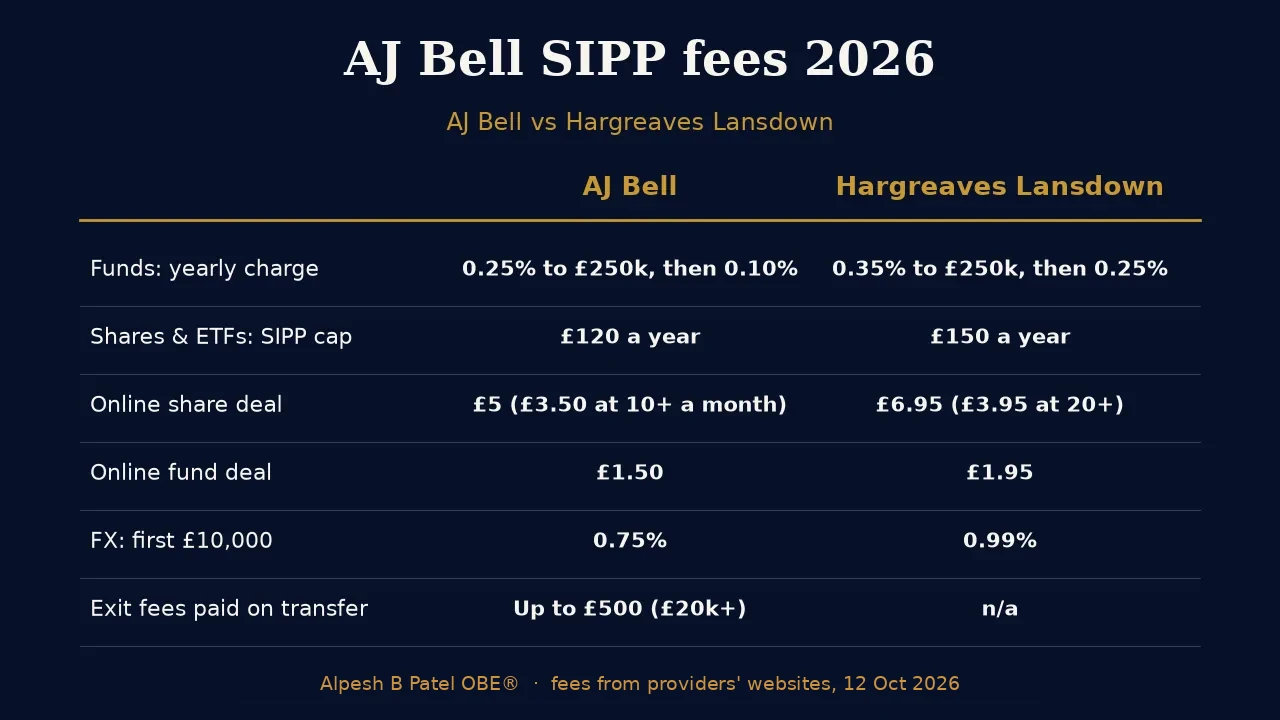
Hargreaves Lansdown SIPP (shares and ETFs)
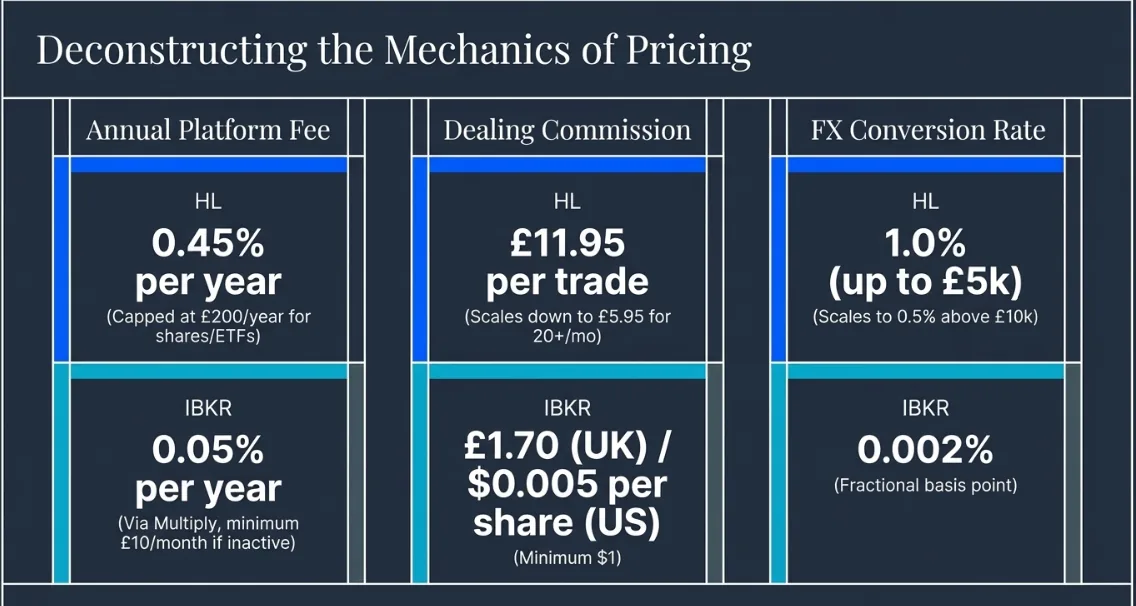
- Platform fee: 0.45% per year, capped at £200/year for shares and ETFs
- Dealing commission: £11.95/trade (£8.95 for 10+ trades/month; £5.95 for 20+)
- FX conversion: 1.0% up to £5,000; 0.75% up to £10,000; 0.5% above £10,000
- Annual cost on a £500,000 portfolio making 20 trades/year (10 US stocks): approximately £419 (platform £200 + dealing £120 + FX £99)
Interactive Brokers SIPP (IBKR Pro / Lite)
- Platform fee: 0.05% per year on the first £hundreds of thousands (IBKR SIPP via Multiply), minimum £10/month if no trading activity
- Dealing commission: £1.70 per UK trade; USD $0.005 per share (minimum $1) for US stocks
- FX conversion: 0.002% (fractional basis point — approximately £2 on a £10,000 conversion vs HL's £75)
- Annual cost on a £500,000 portfolio making 20 trades/year (10 US stocks): approximately £309 (platform £250 + dealing £34 + FX £25)
At £500,000 with 20 trades/year, IBKR saves approximately £110/year over HL — modest in absolute terms. But the gap widens dramatically with more active trading. At 60 trades/year, IBKR saves approximately £600/year. At 100 trades/year, the saving exceeds £1,000 annually.
Where HL Wins
HL's advantages over IBKR are significant and should not be dismissed purely on cost grounds. HL's mobile app is the best in UK retail investing — intuitive, fast, and well-designed. Customer service is telephone-based with fast response times and knowledgeable staff.
The HL research library, fund performance data, and portfolio analytics tools are genuinely useful for the kind of quarterly review process central to the GIP framework. HL's interface is also considerably more accessible for investors who are not comfortable navigating institutional-grade trading software.
Where IBKR Wins
IBKR's advantages are most pronounced for active traders and large portfolios. FX costs are transformationally lower — buying US stocks on HL at £10,000 per trade costs £75 in FX alone; on IBKR, the same conversion costs £2.
For a GIP investor who holds 10–15 US-listed stocks and reviews them quarterly, this adds up to £200–£400 in FX savings per year on HL vs IBKR. IBKR also offers access to more international exchanges, pre-market and after-hours trading, and more sophisticated order types.
The Verdict: Which Platform for Which GIP Investor?
- Portfolio £50,000–£500,000, 10–30 trades/year: HL is the better all-round choice. The service quality, interface, and research tools justify the modest cost premium over IBKR at this portfolio size and trading frequency.
- Portfolio £500,000+, 30+ trades/year or heavy US stock exposure: IBKR's FX and dealing cost savings become material. At £1 million+ with regular rebalancing, the annual saving over HL can exceed £1,500–2,000.
- Preference for simplicity and support: HL regardless of portfolio size. IBKR's interface, while powerful, has a steep learning curve that is not for everyone.
Frequently Asked Questions: IBKR vs HL SIPP
Can I hold a SIPP with Interactive Brokers in the UK?
Yes. IBKR offers a SIPP in the UK through their partnership with Multiply, an FCA-authorised SIPP provider. The SIPP wrapper is held with Multiply while investments are executed through IBKR's infrastructure. The combined offering provides access to IBKR's execution quality and low costs within a UK-regulated SIPP wrapper.
Is Interactive Brokers safe for UK investors?
Yes. Interactive Brokers LLC is regulated by the FCA in the UK, is publicly listed on NASDAQ, and has over $14 billion in equity capital. UK retail clients are covered by FSCS protection up to £85,000. IBKR segregates client assets from their own balance sheet under FCA custody rules.
What are Interactive Brokers' dealing costs for UK stocks?
For UK stocks on the London Stock Exchange, IBKR charges approximately £1.70 per trade (fixed rate for retail UK clients on IBKR Pro). For US stocks, the charge is $0.005 per share with a $1 minimum. Compare this to HL's £11.95 per trade for infrequent traders — a saving of approximately £10 per trade on IBKR.
Is HL or IBKR better for buying US stocks in a SIPP?
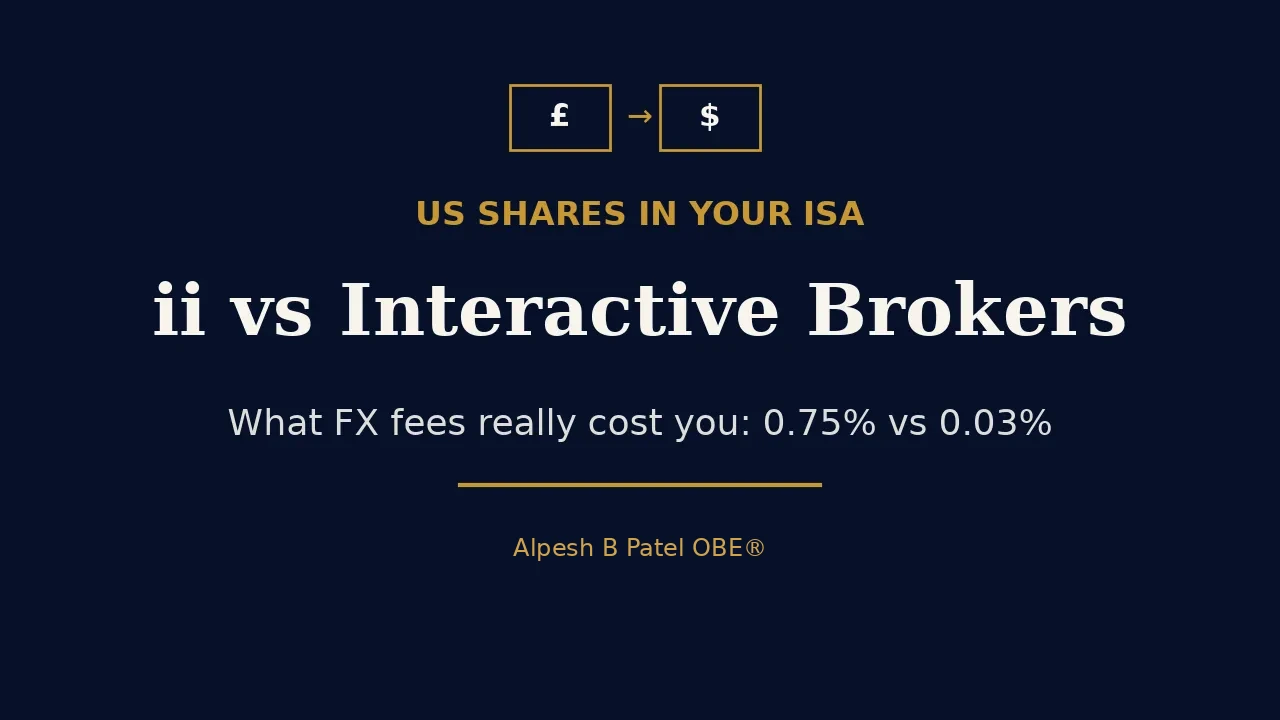
For regular buyers of US stocks, IBKR wins on cost significantly. HL charges 1.0% FX on the first £5,000 of each trade, meaning a £10,000 US stock purchase costs £75 in FX alone. IBKR charges 0.002% — approximately £2 on the same conversion. For a GIP investor making 10 US stock trades per quarter, this represents an annual FX saving of approximately £730.
Should I switch from HL to IBKR?
Run the numbers for your specific situation. Calculate your annual HL cost (platform + dealing + FX) vs IBKR equivalent. If the saving exceeds £300–£500/year and you are comfortable navigating IBKR's more complex interface, the switch is worth considering. If you trade infrequently or value HL's service and interface highly, HL remains strong value for portfolios under £500,000.
If you want help assessing your current platform against the GIP framework, book a free portfolio review here.
Sources & Further Reading
Interactive Brokers UK — SIPP product, charges, and execution quality. interactivebrokers.co.uk (opens in a new tab)
Hargreaves Lansdown — SIPP charges, FX rates, and dealing commissions (2026). hl.co.uk/pensions/sipp (opens in a new tab)
Financial Times — SIPP platform comparison and FX cost analysis for UK investors. ft.com/personal-finance (opens in a new tab)
Good Money Guide — Best SIPP providers 2026 and platform comparison. goodmoneyguide.com (opens in a new tab)
Which? — Investment platform reviews and SIPP comparison. which.co.uk/money/investing (opens in a new tab)
Times Money Mentor — UK investment platform comparison 2026. thetimes.co.uk/money-mentor (opens in a new tab)
Disclaimer: This article is for educational purposes only. All fee figures are based on publicly available information as at March 2026 and are subject to change. This does not constitute a personal recommendation to use any specific platform. Always verify current charges directly with the provider.
Alpesh Patel OBE
Important: this article is education and information only. It is not financial advice or a personal recommendation, and it does not take your circumstances into account. The value of investments and pensions can fall as well as rise, and you may get back less than you put in. Past performance is not a reliable indicator of future results. Figures were correct when the article was written and may have changed. If you are unsure what is right for you, speak to a regulated financial adviser.