
Sharpe vs Sortino vs Calmar Ratio: Which Risk Measure Should UK Investors Use?
By Alpesh Patel OBE, Founding Principal of Rootbridge Capital and author
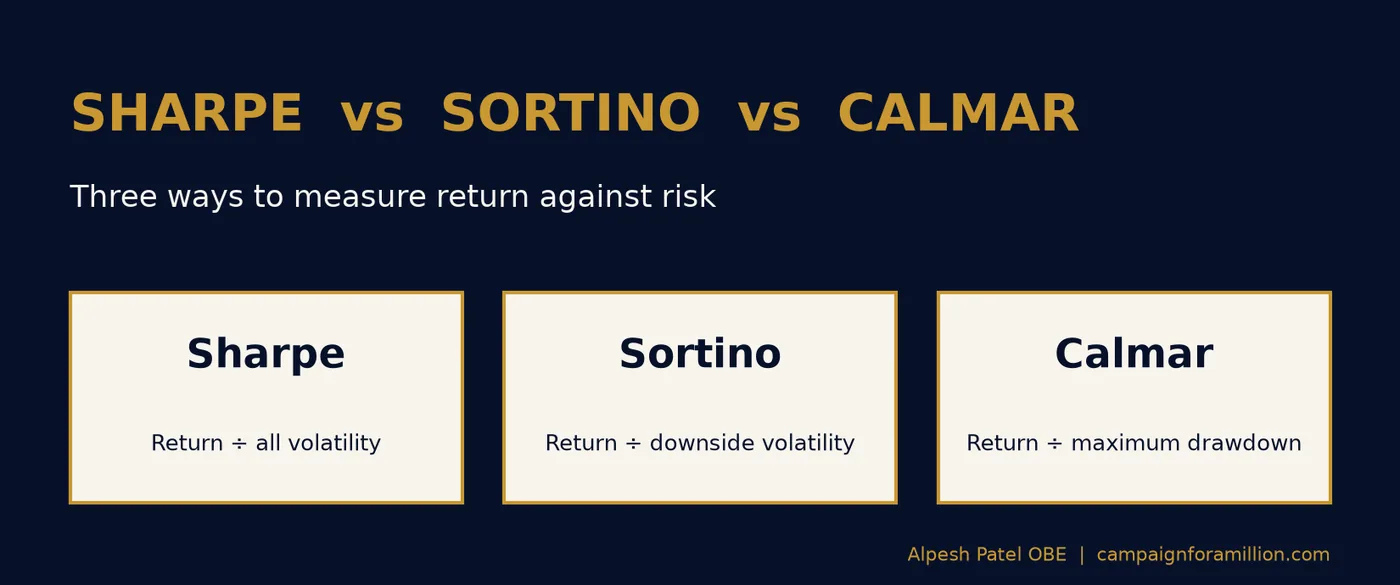
Short answer: the Sharpe ratio measures return against all volatility, the Sortino ratio measures return against downside volatility only, and the Calmar ratio measures return against the worst peak-to-trough fall (maximum drawdown). Used together, they tell you not just how much a fund or share returned, but how painful it was to hold. If you only look at one, look at the one that matches the risk you actually fear.
Most investors judge a fund by its return. Professionals judge it by the return per unit of risk. Two funds can both make 9% a year, and one can still be far worse to own. These three ratios are how you tell them apart.
What is the Sharpe ratio?
The Sharpe ratio is the extra return you earned above cash, divided by how much the investment's returns bounced around (standard deviation). It was created by Nobel laureate William F. Sharpe in 1966.
Sharpe ratio = (Return − Risk-free rate) ÷ Standard deviation of returns
- Higher is better: you are getting more return for each unit of volatility.
- Weakness: it treats a sudden 10% rise as just as "risky" as a sudden 10% fall. Most investors don't lie awake worrying about upside surprises.
Read my full guide: The Sharpe ratio explained (opens in a new tab).
What is the Sortino ratio?
The Sortino ratio is the same idea as Sharpe, but it only counts the bad volatility: the months when returns fell below your target. It is named after Frank Sortino, who developed it in the 1980s.
Sortino ratio = (Return − Target or risk-free rate) ÷ Downside deviation
- Higher is better: more return for each unit of downside risk.
- Why it matters: it rewards investments that go up in jumps but fall gently, which is what most of us actually want.
On the Great Investments Programme we specifically look for companies with high historic Sortino ratios, because research suggests that quality tends to persist. Read more: The Sortino ratio explained (opens in a new tab).
What is the Calmar ratio?
The Calmar ratio is the annual return divided by the largest peak-to-trough fall (maximum drawdown), usually measured over the last three years. Terry Young introduced it in 1991; the name comes from his newsletter, CALifornia MAnaged accounts Reports.
Calmar ratio = Annualised return ÷ Maximum drawdown
- Higher is better: more return for each pound of worst-case loss.
- Why it matters: drawdown is the risk people really feel. A 40% fall needs a 67% gain just to get back to where you started, and it is the moment most investors panic and sell.
Read more: The Calmar ratio explained (opens in a new tab).
Sharpe vs Sortino vs Calmar: what's the difference?
| Sharpe ratio | Sortino ratio | Calmar ratio | |
|---|---|---|---|
| What it divides by | All volatility | Downside volatility only | Maximum drawdown |
| Question it answers | How bumpy was the ride? | How bad were the bad months? | How bad was the worst fall? |
| Penalises upside jumps? | Yes | No | No |
| Typical period | Any (often 3–5 years) | Any (often 3–5 years) | Usually 3 years |
| Best for | Comparing diversified funds | Shares and funds with uneven returns | Anyone who fears a big crash |
| Main weakness | Assumes ups and downs are equally bad | Needs enough down months to be reliable | Based on a single worst event |
A worked example: two funds, same return, different risk
Here are two illustrative funds (not real products). Both return 9% a year and have the same 15% volatility. Assume cash pays 4%.
| Fund A | Fund B | |
|---|---|---|
| Annual return | 9% | 9% |
| Volatility (standard deviation) | 15% | 15% |
| Downside deviation | 9% | 12% |
| Maximum drawdown | 30% | 20% |
| Sharpe ratio | 0.33 | 0.33 |
| Sortino ratio | 0.56 | 0.42 |
| Calmar ratio | 0.30 | 0.45 |
The Sharpe ratio says the two funds are identical. They aren't:
- Sortino prefers Fund A: its month-to-month falls are smaller.
- Calmar prefers Fund B: its single worst fall was a third smaller.
That's the point. Each ratio sees a different kind of risk, so one number on its own can mislead you. If your biggest fear is a crash that tempts you to sell at the bottom, Calmar matters most. If you're picking shares that tend to rise in spurts, Sortino tells you more than Sharpe.
Which ratio should I use?
- Use Sharpe to compare broad, diversified funds where returns are fairly even.
- Use Sortino when judging individual shares or strategies with lopsided returns. It's one of the five metrics in our professional stock-screening framework (opens in a new tab).
- Use Calmar to stress-test yourself: could you really sit through that maximum drawdown without selling?
- Use all three together, over the same period, and compare like with like (same time frame, same currency, same risk-free rate).
How we use these ratios on the Great Investments Programme
There's no crystal ball. What there is, is a process. We judge every portfolio on how it behaved in its worst periods, not just its average. We look for companies with strong historic Sortino ratios alongside value, growth and momentum. And we size portfolios to each member's own risk capacity, so you know the worst case in advance and are far less likely to panic.
You can see the live picks we've actually given clients (not backtests) at shares.alpeshpatel.com.
Frequently asked questions
What is a good Sharpe ratio?
As a loose rule of thumb, above 1 over a long period is considered good and above 2 is rare. But it depends heavily on the period measured. Always compare funds over the same dates.
Is the Sortino ratio better than the Sharpe ratio?
For most private investors, yes, because it only penalises falls. But it needs a long enough history with enough down months to be reliable.
Can the Calmar ratio be negative?
Yes. If the annual return over the period was negative, the Calmar ratio is negative too, and comparing negative ratios can be misleading.
Where can I find these ratios for a fund?
Many fund factsheets and platforms show the Sharpe ratio. Sortino and Calmar are less common; you can calculate them from monthly returns in a spreadsheet, or use screening software such as ShareScope.
Do these ratios predict future returns?
No. They describe past risk and return. They are useful for asking better questions, not for guaranteeing anything.
Want to know how your own portfolio scores?
Book a call with my team. We'll look at what you hold now, how it has behaved in falls, and whether the Great Investments Programme makes sense for you.
Important: This article is for education only and is not personal financial advice. This is general investment education only and is not regulated investment advice. The value of investments can go down as well as up, and you may get back less than you invest. Past performance is not a reliable indicator of future results. Fund A and Fund B are hypothetical examples for illustration only.
Important: this article is education and information only. It is not financial advice or a personal recommendation, and it does not take your circumstances into account. The value of investments and pensions can fall as well as rise, and you may get back less than you put in. Past performance is not a reliable indicator of future results. Figures were correct when the article was written and may have changed. If you are unsure what is right for you, speak to a regulated financial adviser.