J.P. Morgan Guide to the Markets, November 2026: 48 Charts on UK and US Shares, Explained
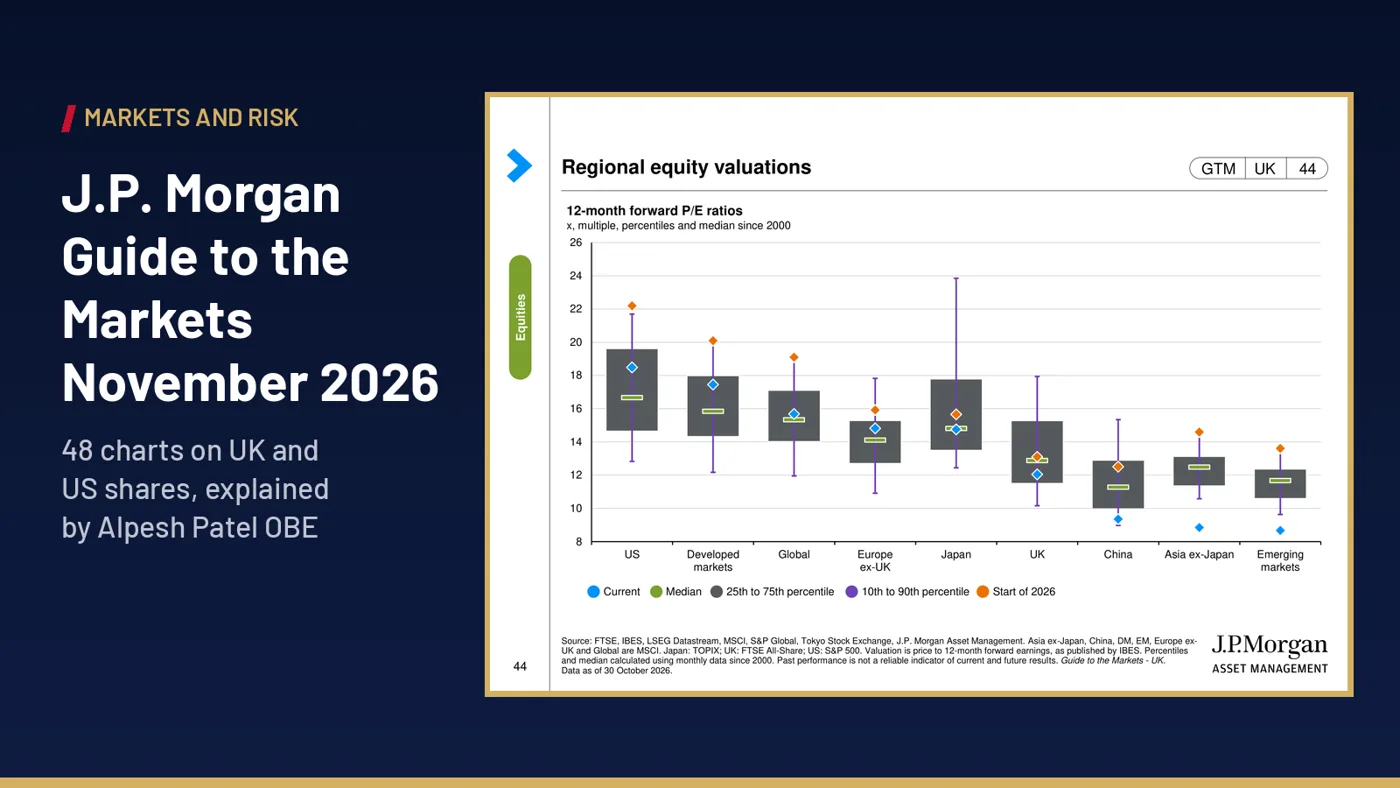
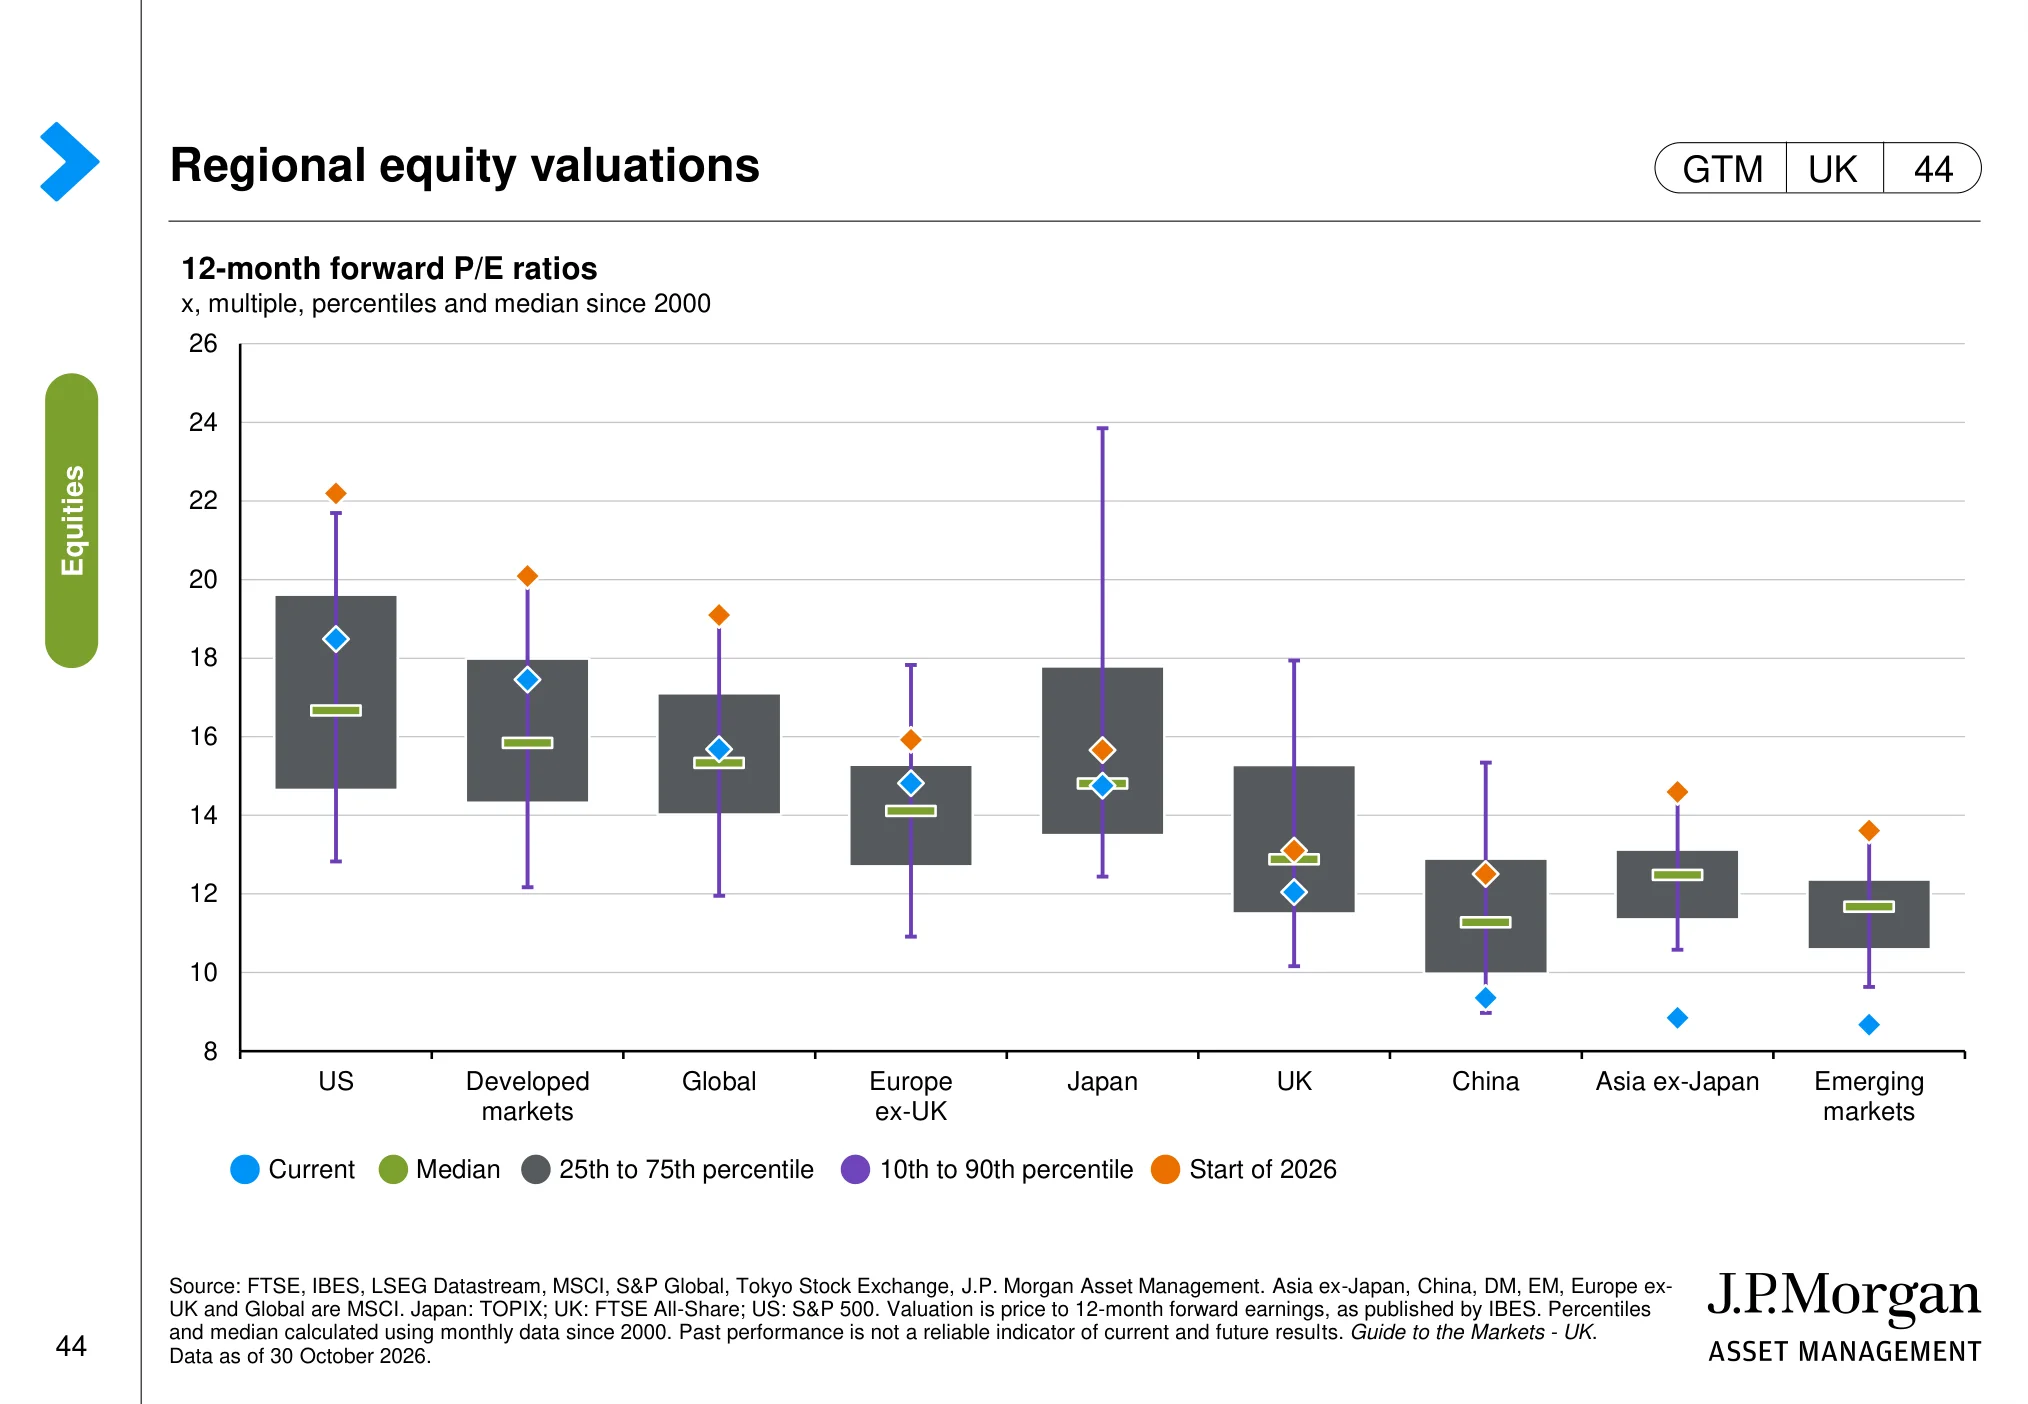
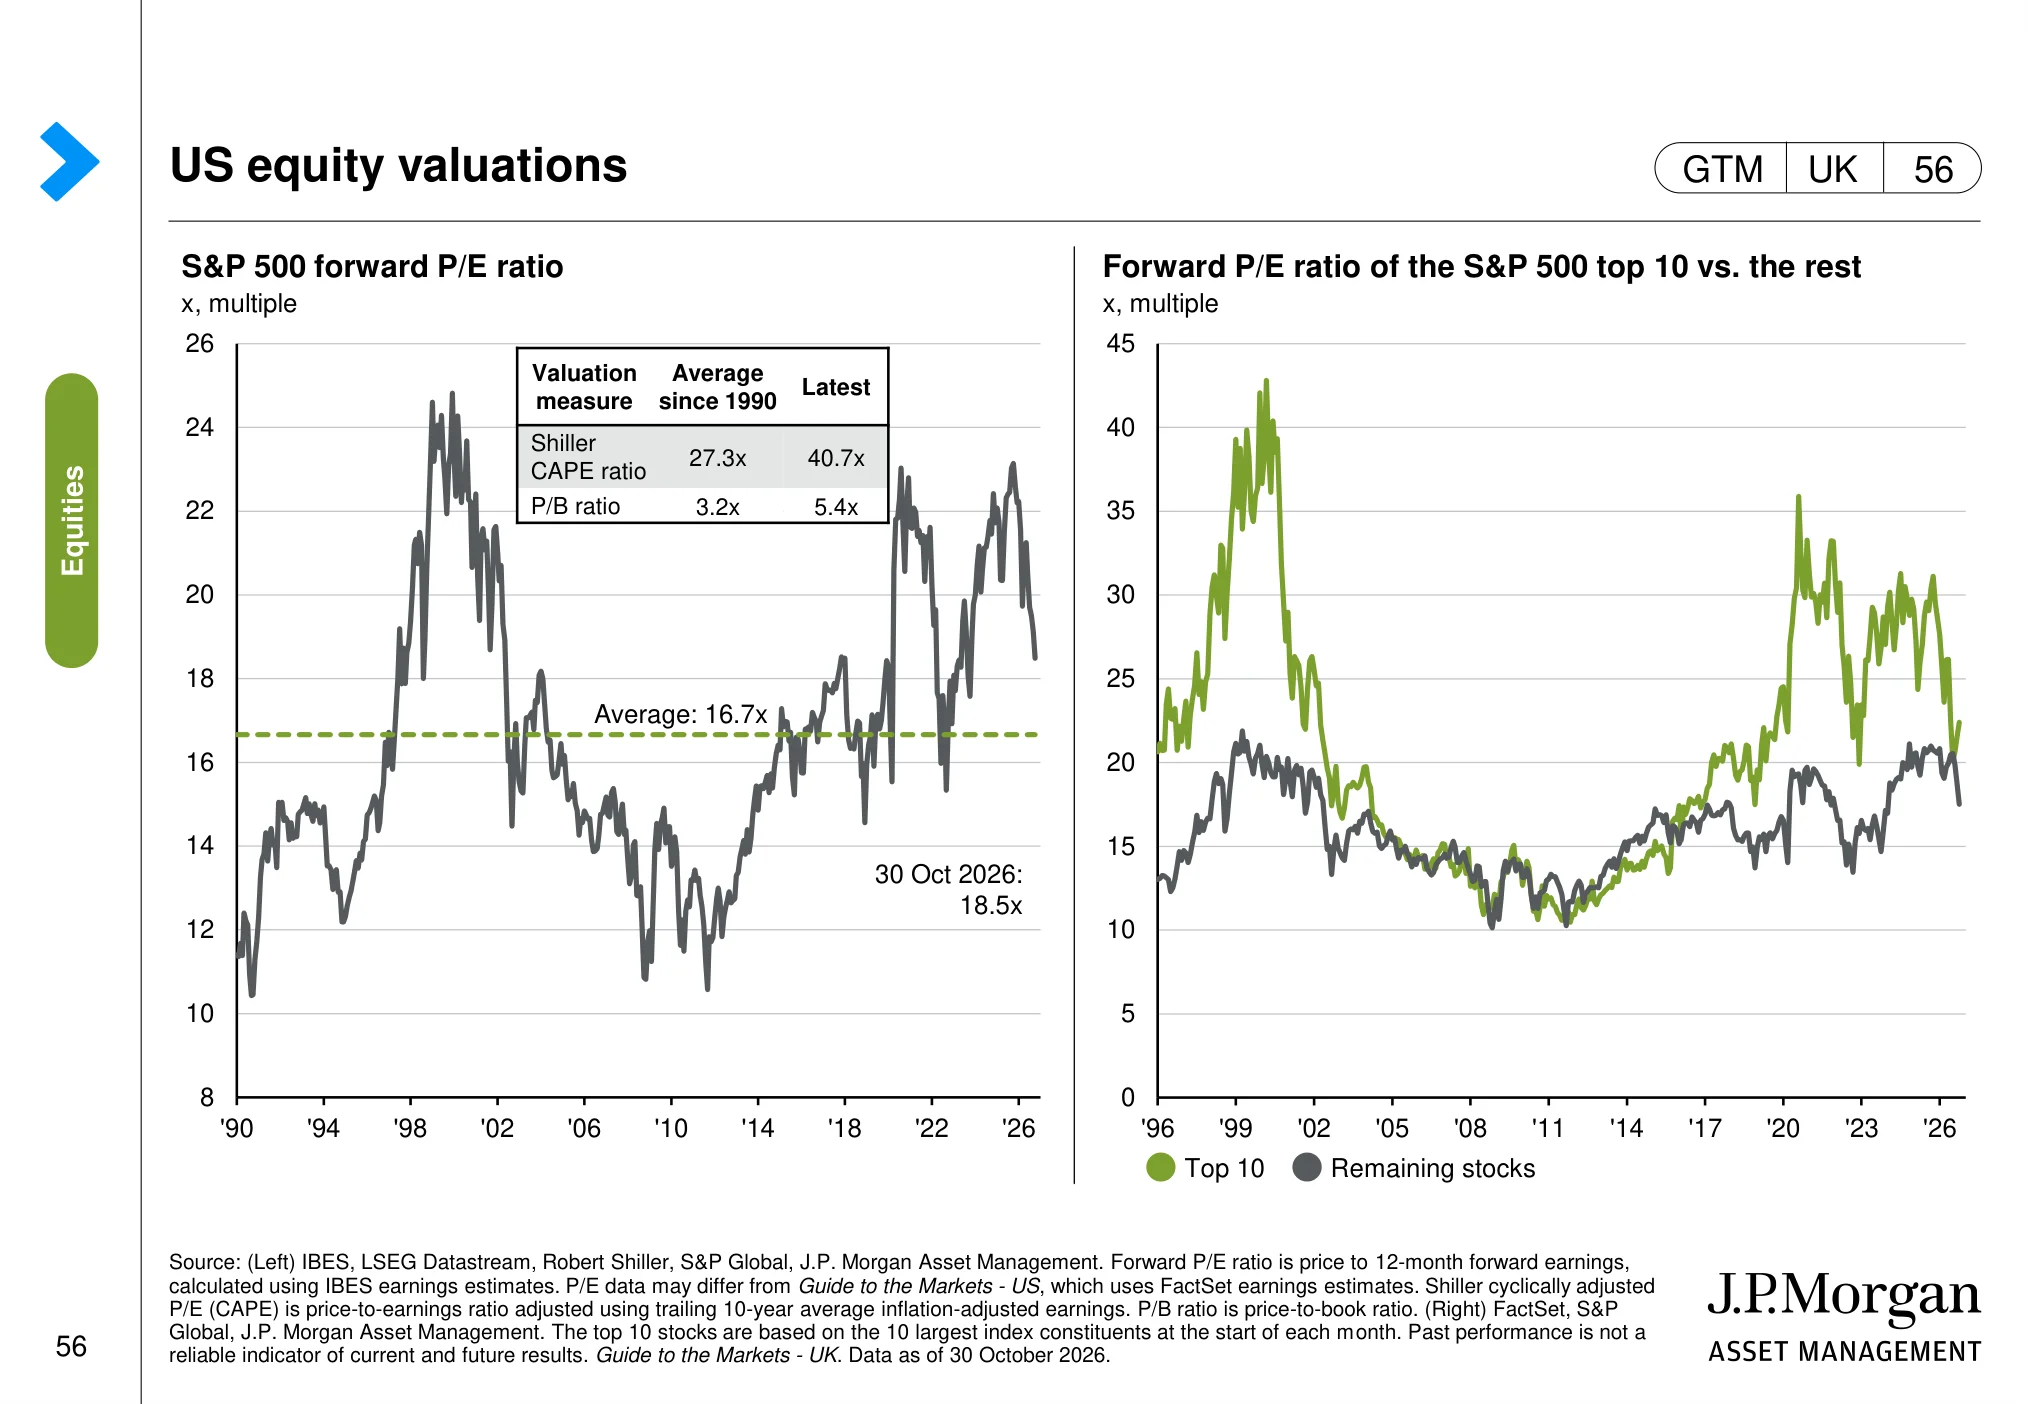
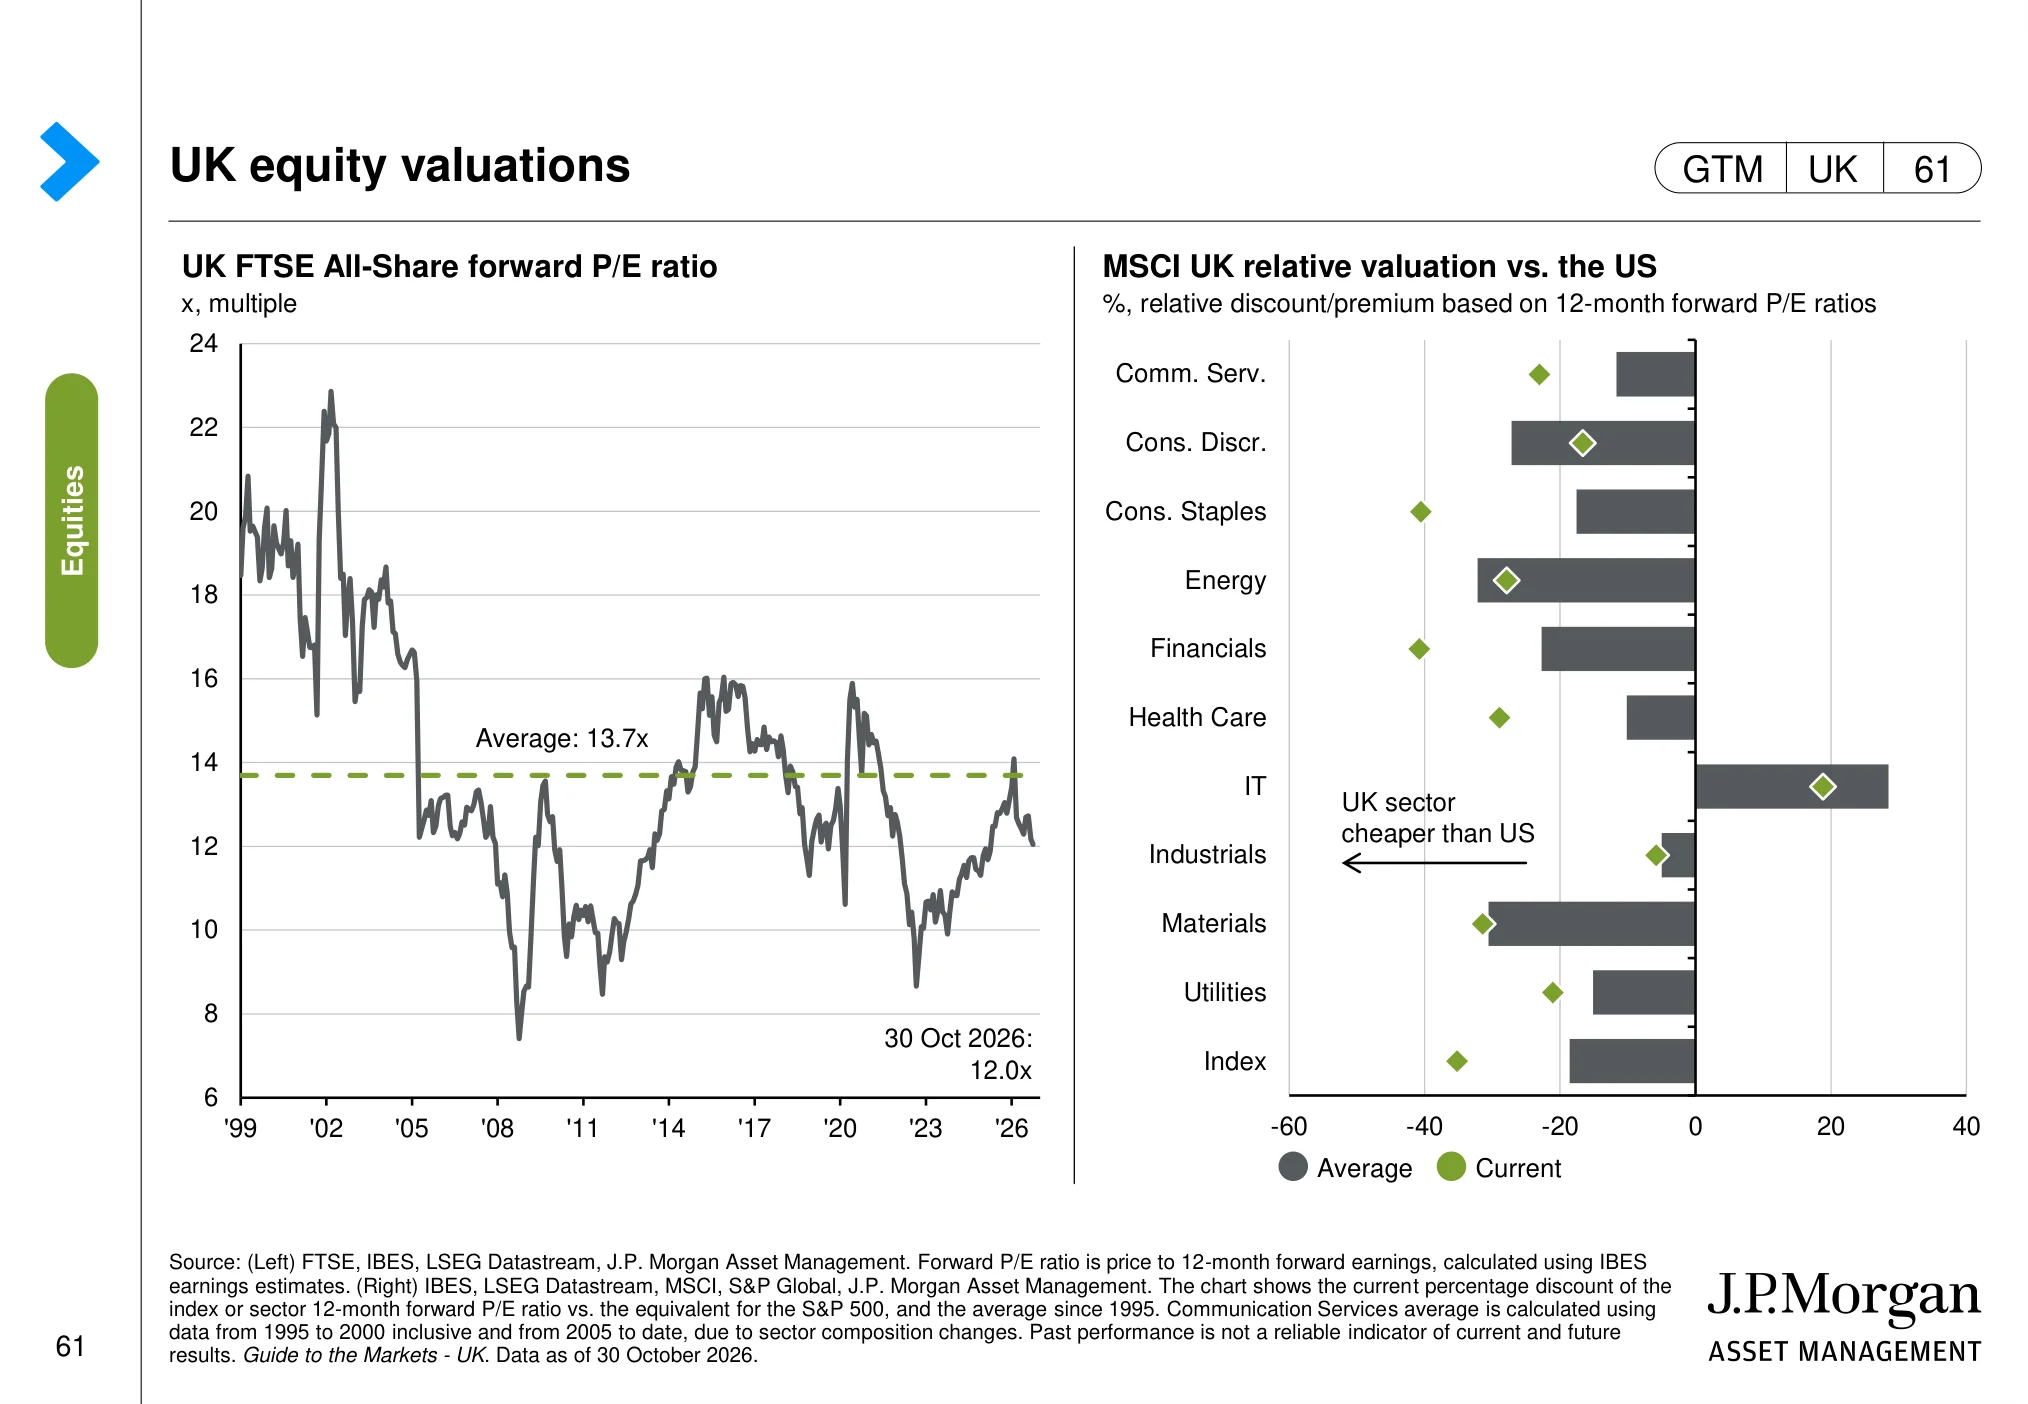
On 30 October 2026, the S&P 500 traded at 18.5 times the next twelve months' expected earnings. That is above its 16.7x average since 1990, yet a long way below the roughly 22x it started the year on. The UK's FTSE All-Share sits at about 12x, below its own median since 2000. Same month, same data, two very different starting points for anyone buying shares today.
Those numbers come from the J.P. Morgan Asset Management Guide to the Markets – UK (opens in a new tab), one of the most widely used chart books in the investment industry. It is written for financial professionals and refreshed every quarter, and it is excellent. It is also dense: around 100 pages of charts, footnotes and acronyms.
So I have picked the 48 slides that matter most to a UK or global investor in UK and US shares, and written a plain-English note under each one: what the chart shows, and why it matters for your money. This is for education. No forecasts, no tips, just a way to read the same evidence the professionals use.
Short answer: The J.P. Morgan Guide to the Markets – UK (data as of 30 October 2026) shows resilient global growth, sticky inflation and higher rate expectations. US shares are more expensive than UK shares and far more concentrated in AI-linked giants. The investing-principles pages show volatility is normal and time in the market narrows the range of outcomes.
Want help turning charts like these into a process you can actually follow? Book your free call with Alpesh's team (opens in a new tab). We will show you how to read valuations, concentration and risk in your own portfolio. There is nothing to buy on the call.
How to read the J.P. Morgan Guide to the Markets
Every slide below is reproduced unaltered from J.P. Morgan Asset Management, with its own source line and data date in the footer. Under each one you will find two short notes I have written:
- The chart: what is being measured, in plain English.
- Why it matters: the link from that chart to company profits, share prices or your portfolio.
Three habits make the guide far more useful. First, read the axis and the unit before the line: a "% change year on year" chart and an "index level" chart tell very different stories. Second, look for the long-run average or median, because most valuation charts only mean something relative to their own history. Third, remember that a chart describes the past and the present. It does not tell you what the market will do next month.
J.P. Morgan's own big themes this quarter
In its Q4 2026 key themes (opens in a new tab), J.P. Morgan's Market Insights team highlights three ideas. The global economy "has so far been resilient in the face of yet another shock", with energy prices lifting inflation while subdued wage pressures give central banks room to be patient. US and emerging stock markets "remain incredibly concentrated towards the AI theme", which J.P. Morgan says strengthens the case for regional diversification. And bond yields are rising because governments and companies are borrowing heavily, which it argues makes higher yields "increasingly attractive for long-term investors".
Keep those three ideas in mind as you go through the slides. They are J.P. Morgan's views, not mine, and the charts let you test them for yourself.
The global economy: growth, inflation and rates
The first eight slides set the backdrop. Before you look at a single share price, you want to know whether economies are growing, whether inflation is under control and what central banks are likely to do with interest rates. Those three things drive company revenues, costs and the price investors are prepared to pay for future profits.
Global growth (page 4)
 (opens in a new tab)
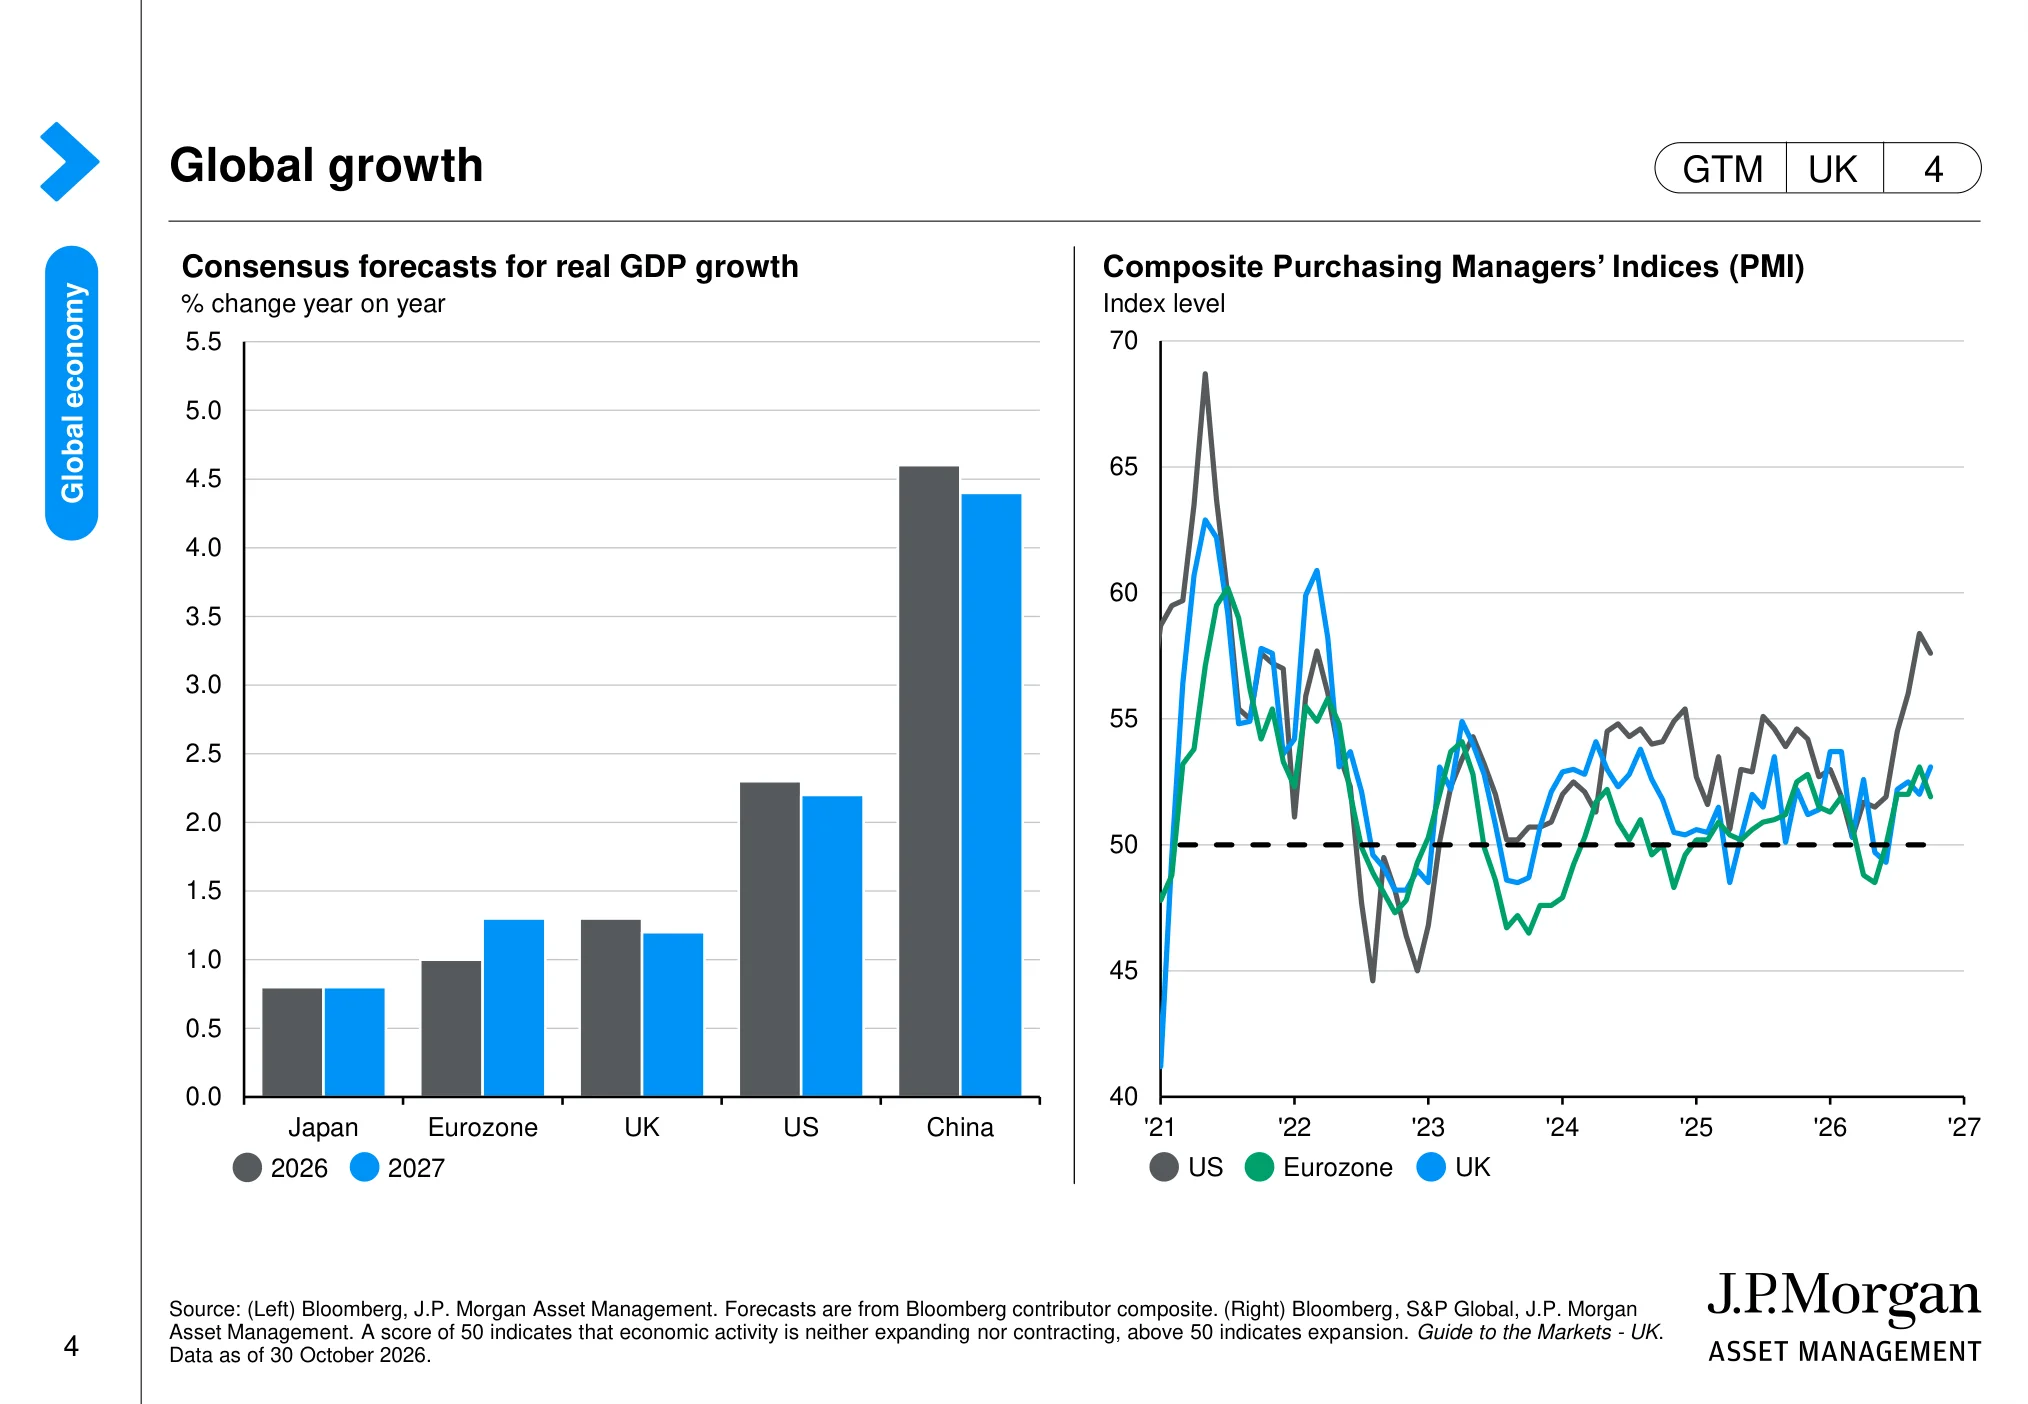
The chart: GDP forecasts point to continued growth across the major economies, with the US forecast stronger than the UK. The PMI lines show US and UK business activity around or above the 50 level, which separates expansion from contraction.
Why it matters: The backdrop is not uniform: stronger US activity may support US company revenues, while the softer UK outlook calls for more selectivity.
Global composite Purchasing Managers’ Index (PMI) (page 5)
 (opens in a new tab)
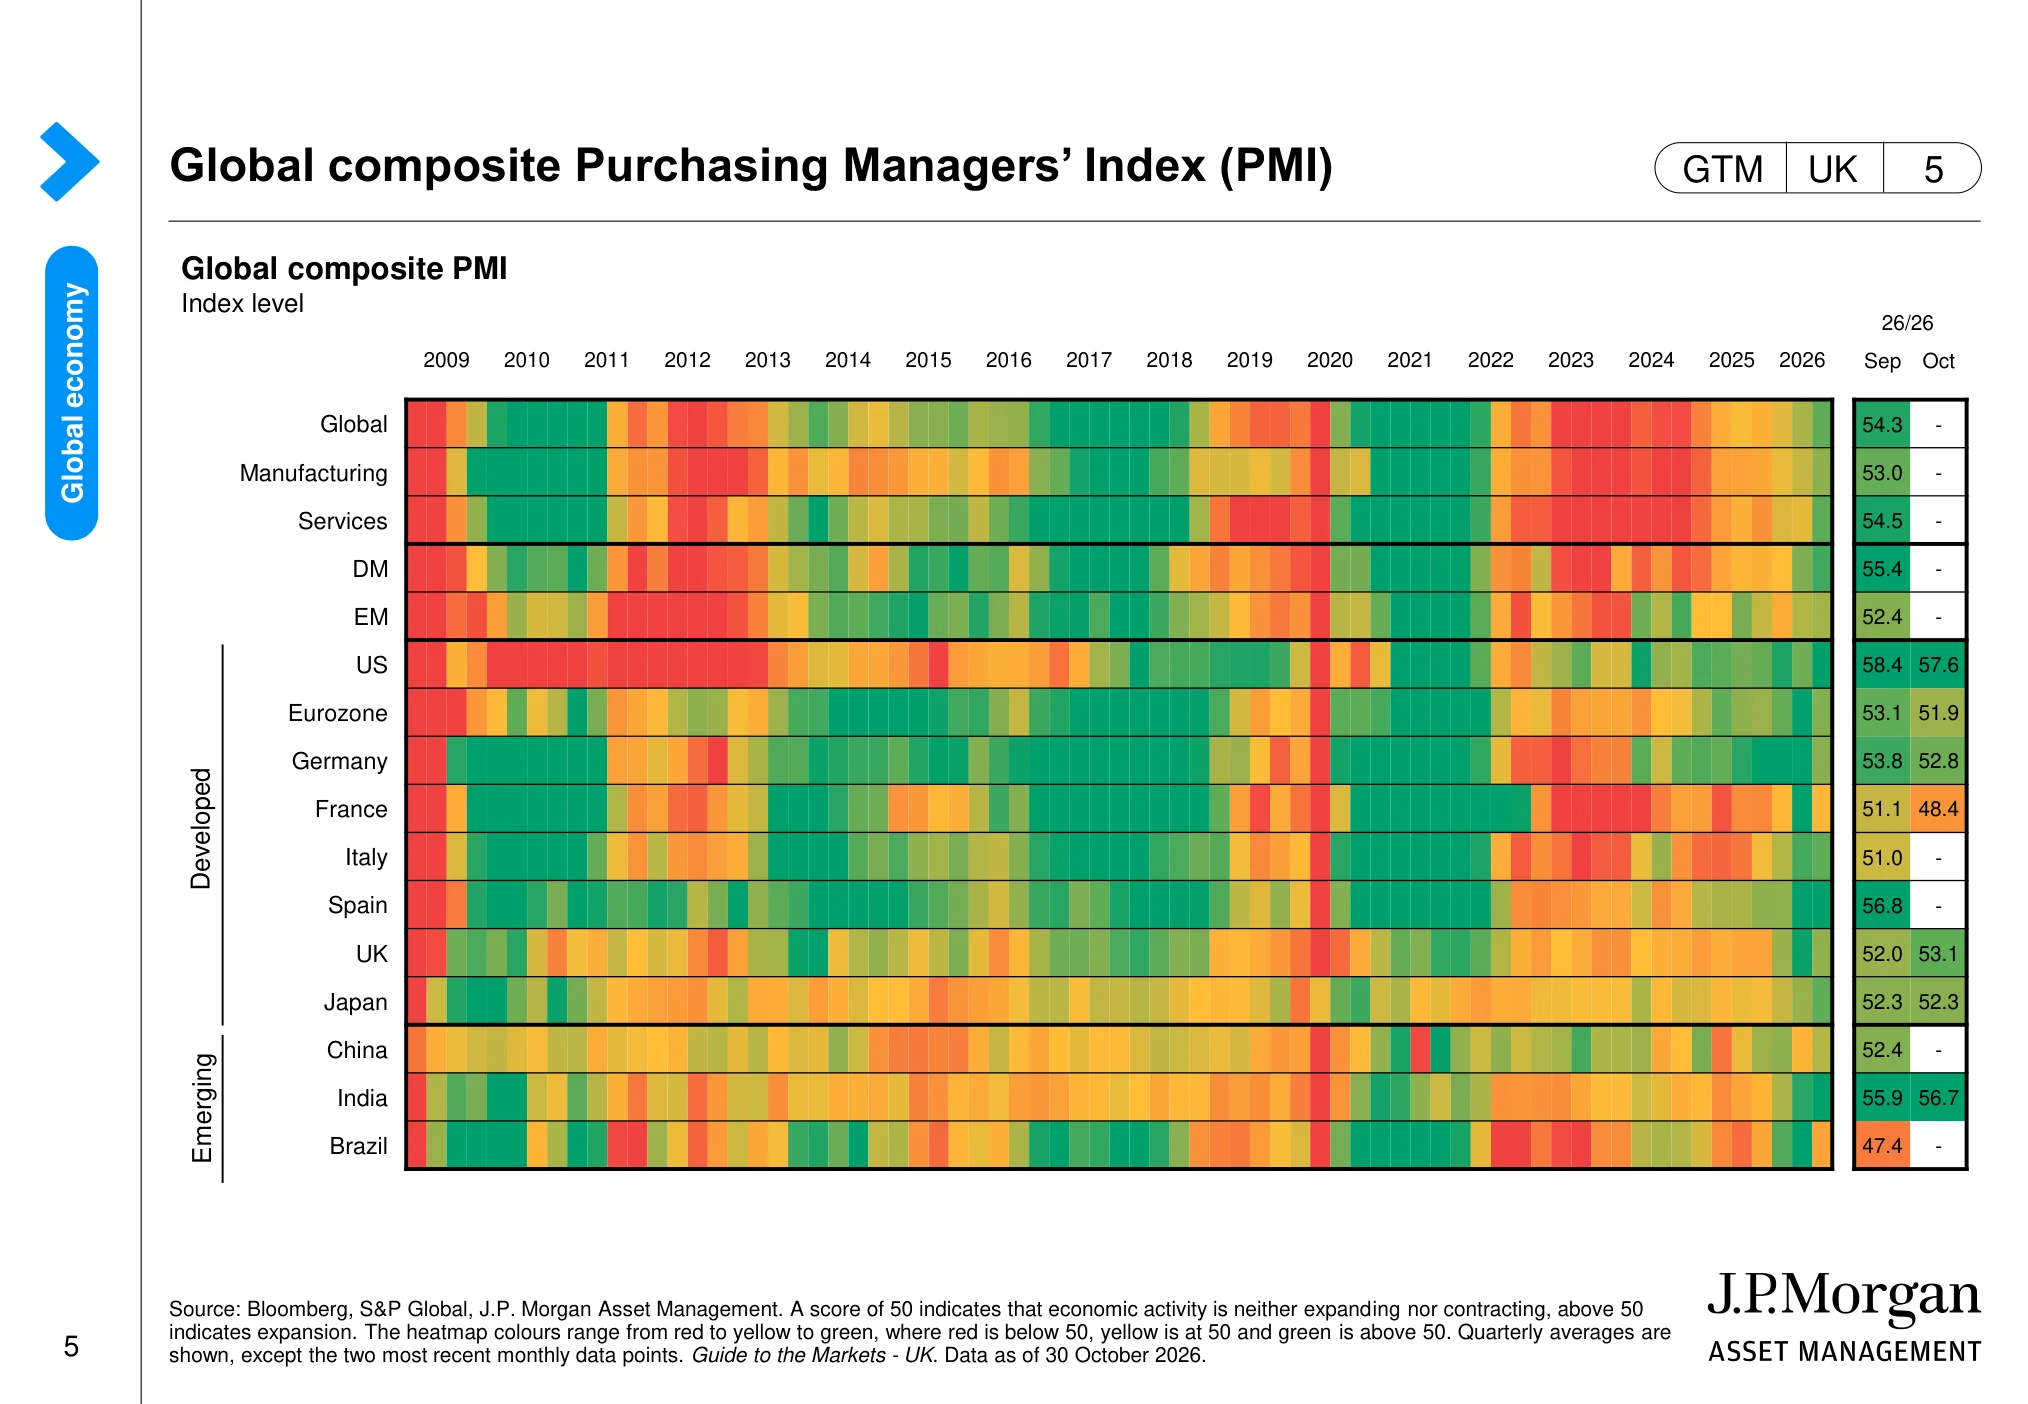
The chart: The PMI heatmap tracks manufacturing and services activity across countries over time. The latest readings show the US and UK in expansion territory, while conditions differ across other regions.
Why it matters: PMIs provide a timely read on demand and business momentum that can feed through to company sales and earnings.
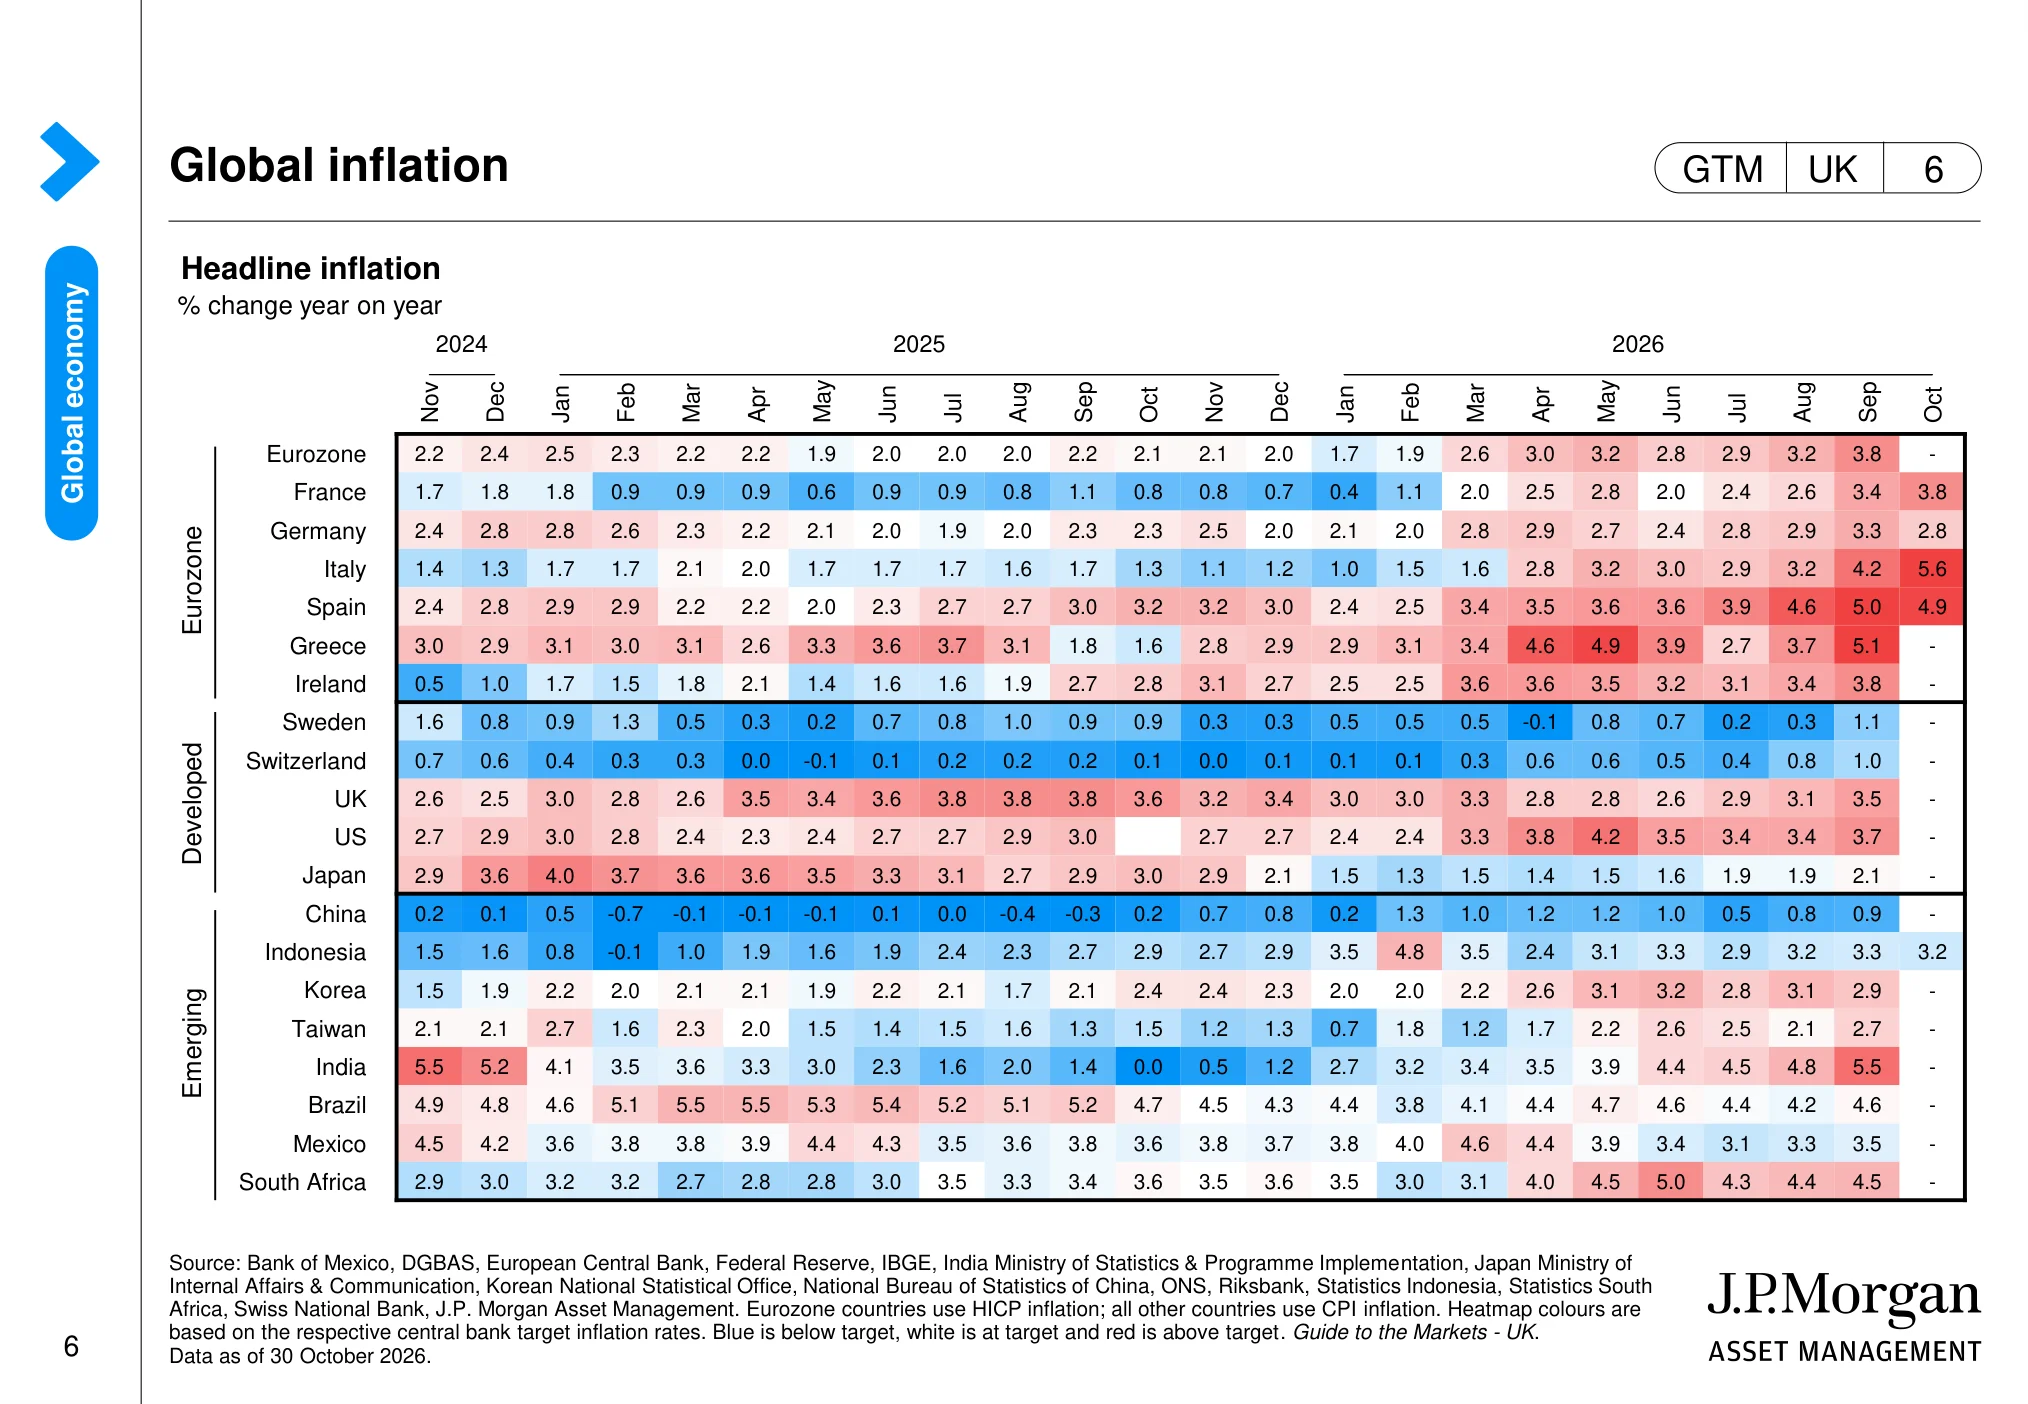
Global inflation (page 6)
 (opens in a new tab)
The chart: The inflation table compares year-on-year consumer price changes across countries and months. UK and US inflation remain important reference points for judging whether price pressures are easing or persisting.
Why it matters: Inflation affects household spending power, company input costs and the likely path of interest rates.
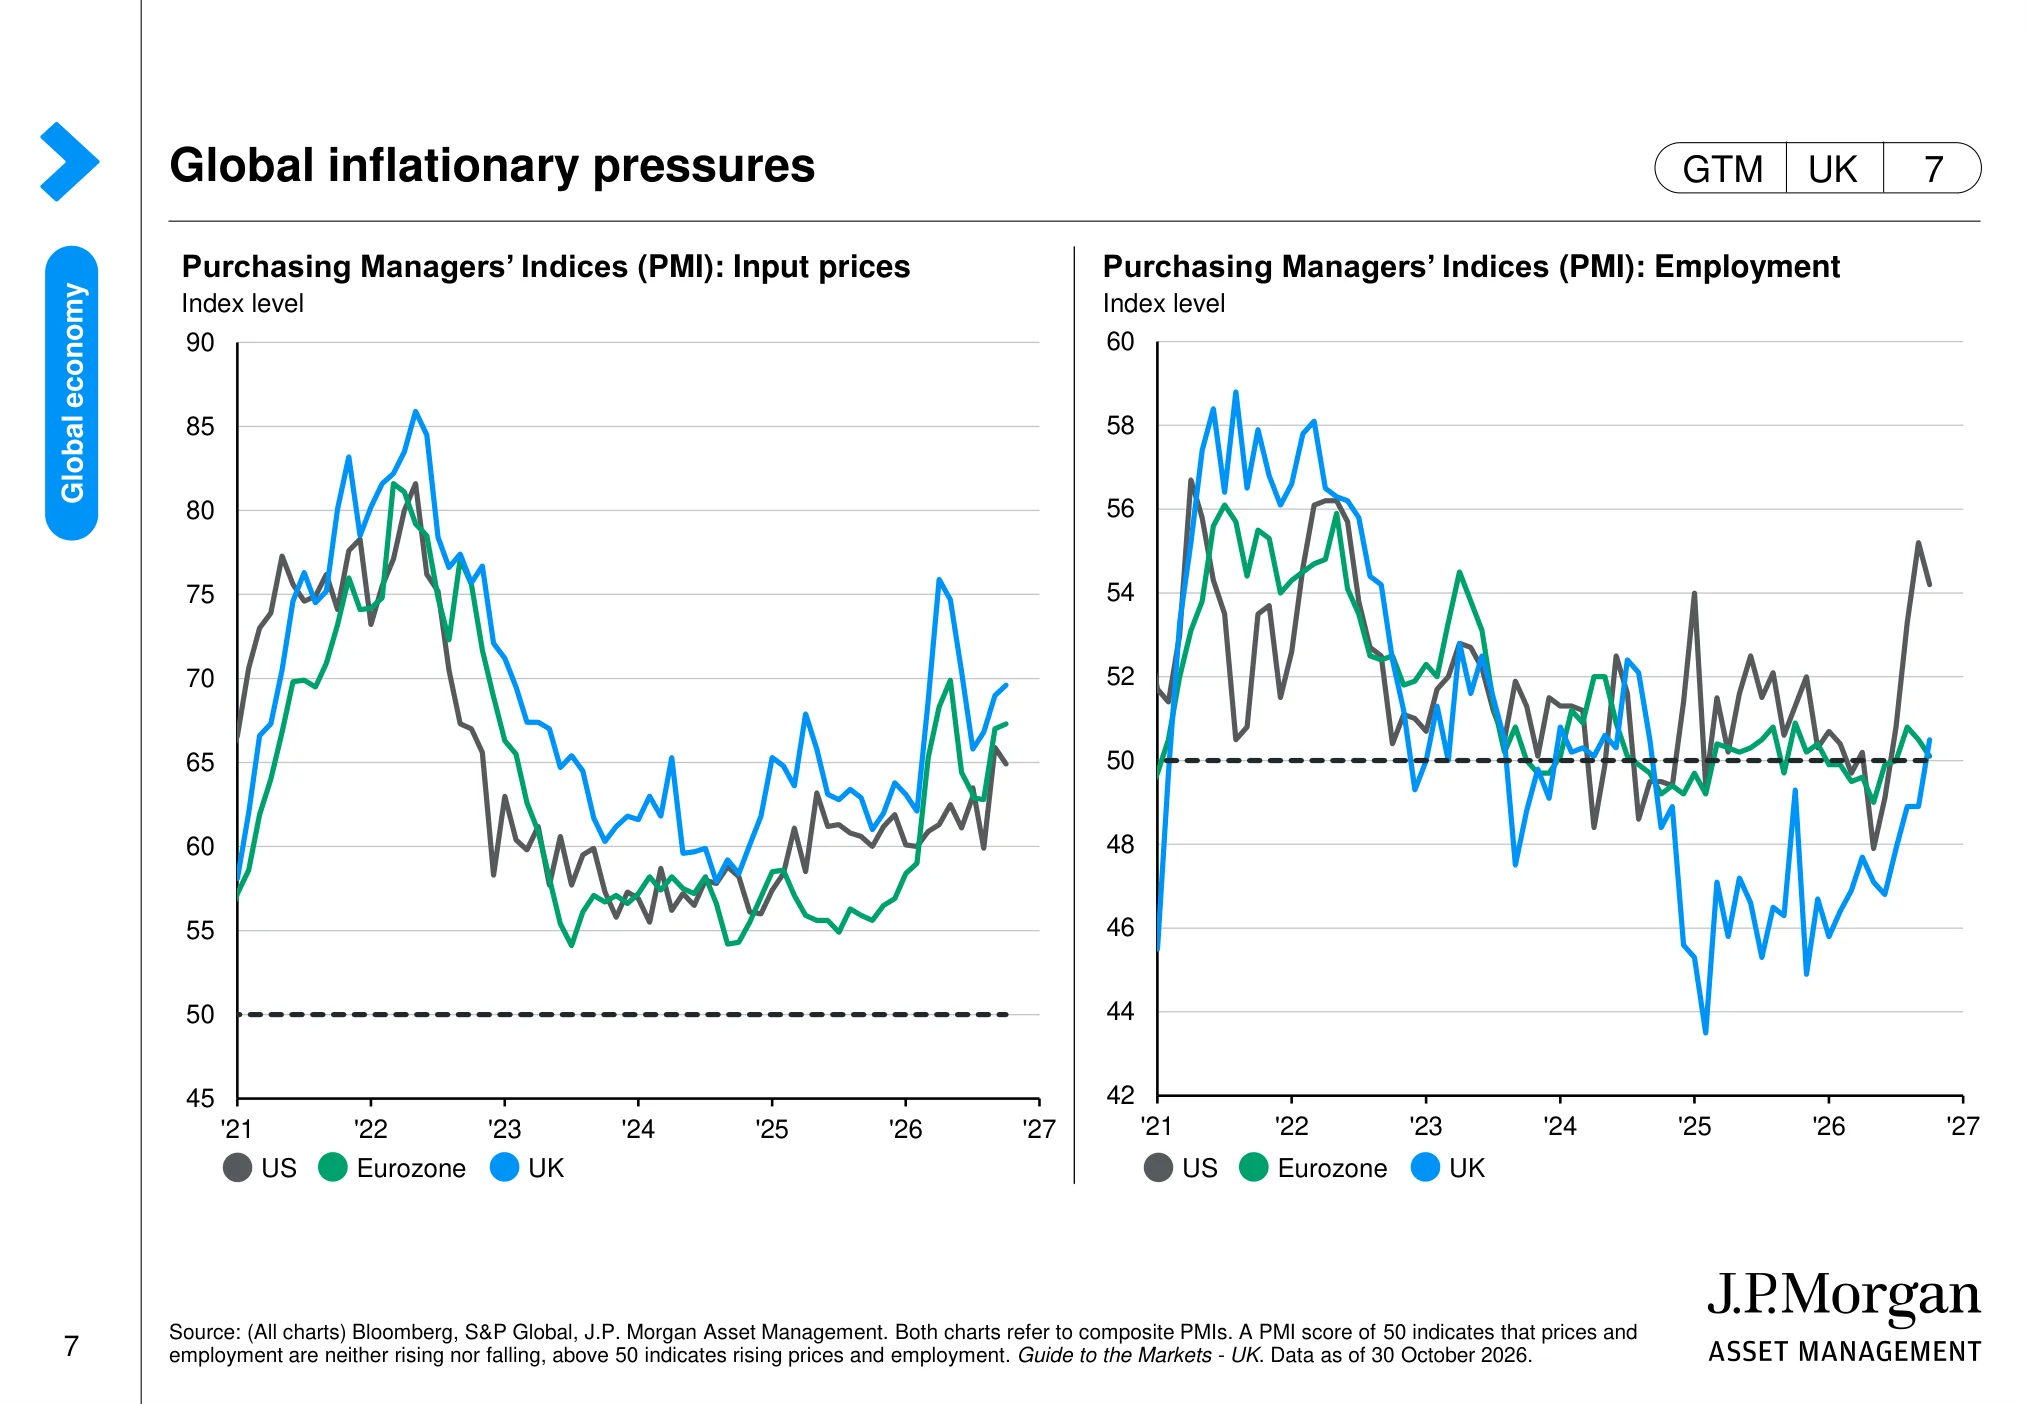
Global inflationary pressures (page 7)
 (opens in a new tab)
The chart: The charts compare business input-price pressures and employment conditions in the US, UK and eurozone. Readings around 50 indicate broadly stable conditions; moves above or below it signal rising or falling pressure.
Why it matters: Input costs and labour demand influence margins, wage pressure and the outlook for central-bank policy.
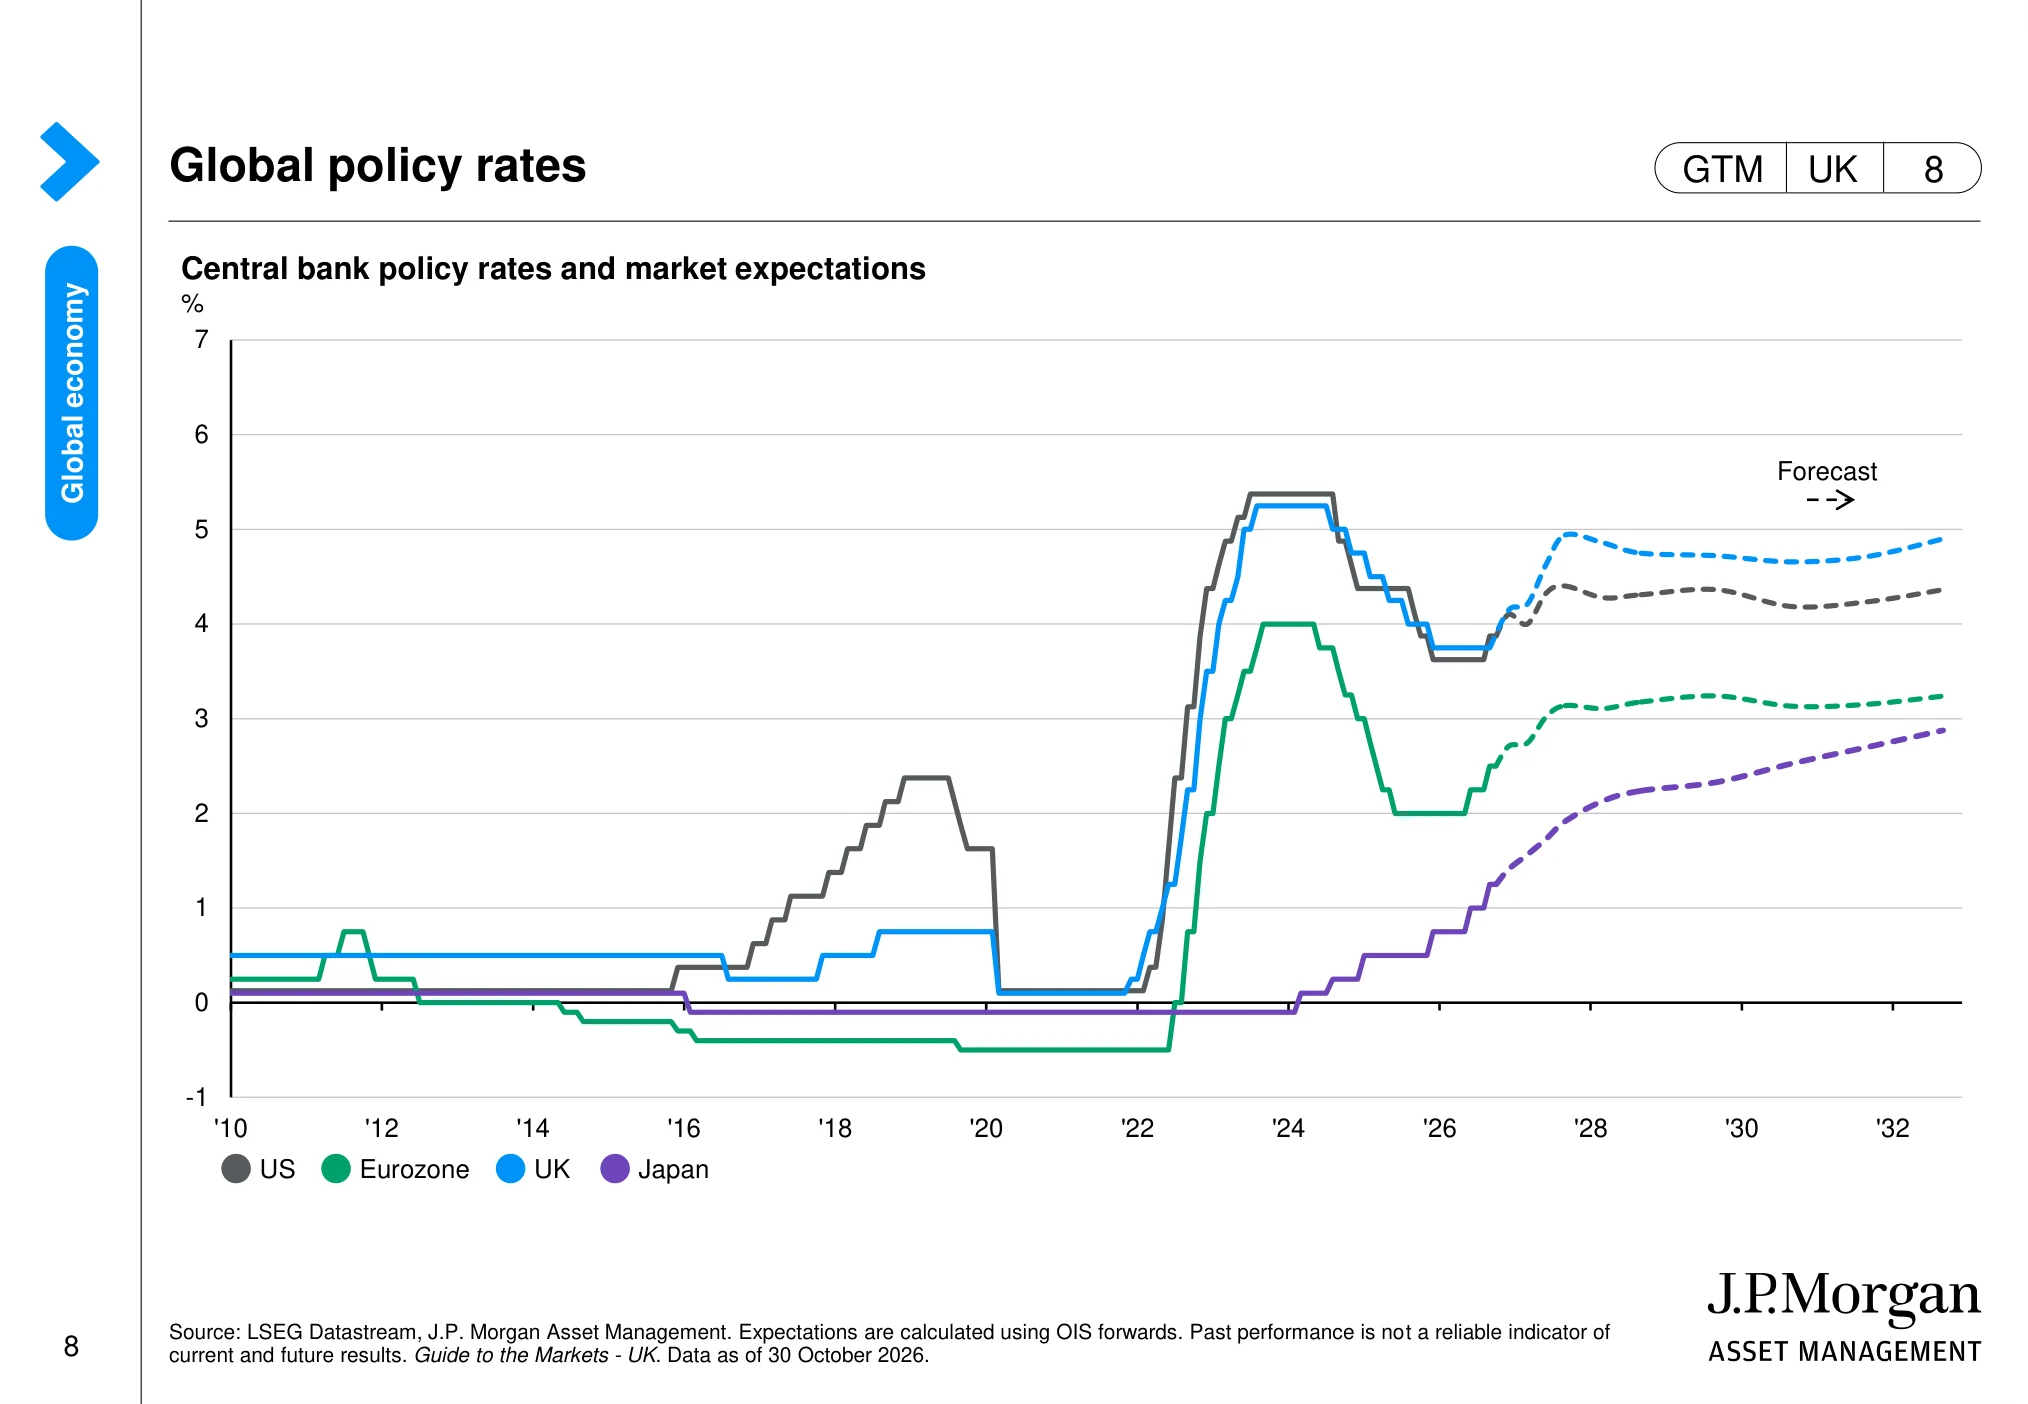
Global policy rates (page 8)
 (opens in a new tab)
The chart: The chart shows central-bank policy rates alongside market expectations. It compares the US Federal Reserve and Bank of England with other major central banks, including the projected path priced by markets.
Why it matters: Rate expectations matter because they influence discount rates, borrowing costs and the valuation investors are willing to pay for shares.
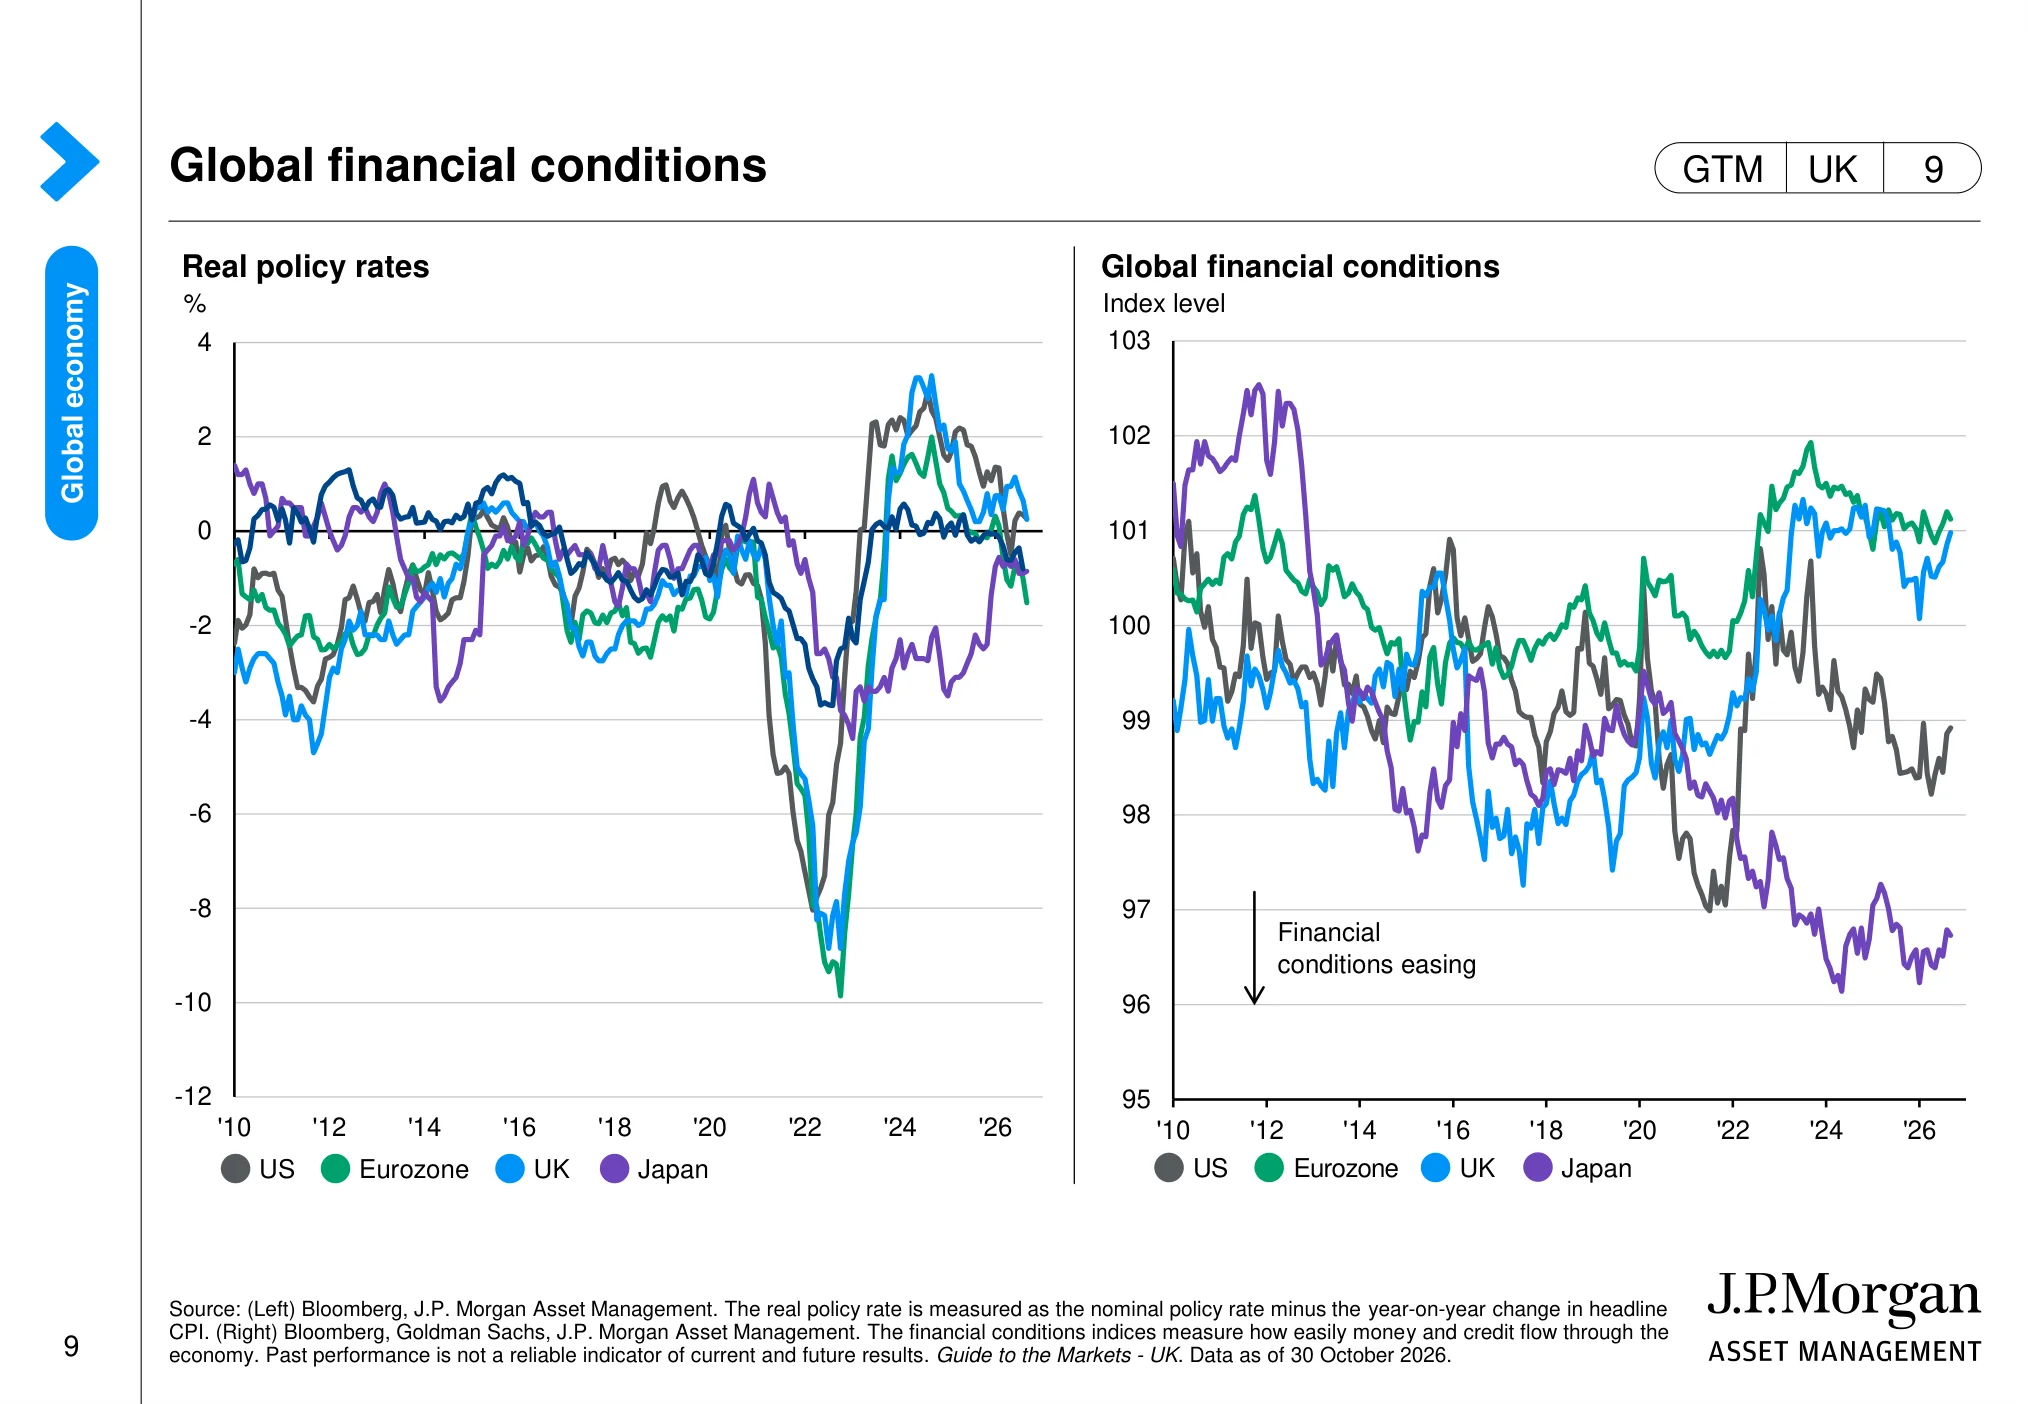
Global financial conditions (page 9)
 (opens in a new tab)
The chart: The page compares real policy rates and financial-conditions indices across major economies. It shows whether policy is restrictive after accounting for inflation and whether financing conditions are tightening or easing.
Why it matters: Tighter financial conditions can weigh on investment and valuations; easier conditions can support demand and risk appetite.
Global consumer balance sheets (page 12)
 (opens in a new tab)
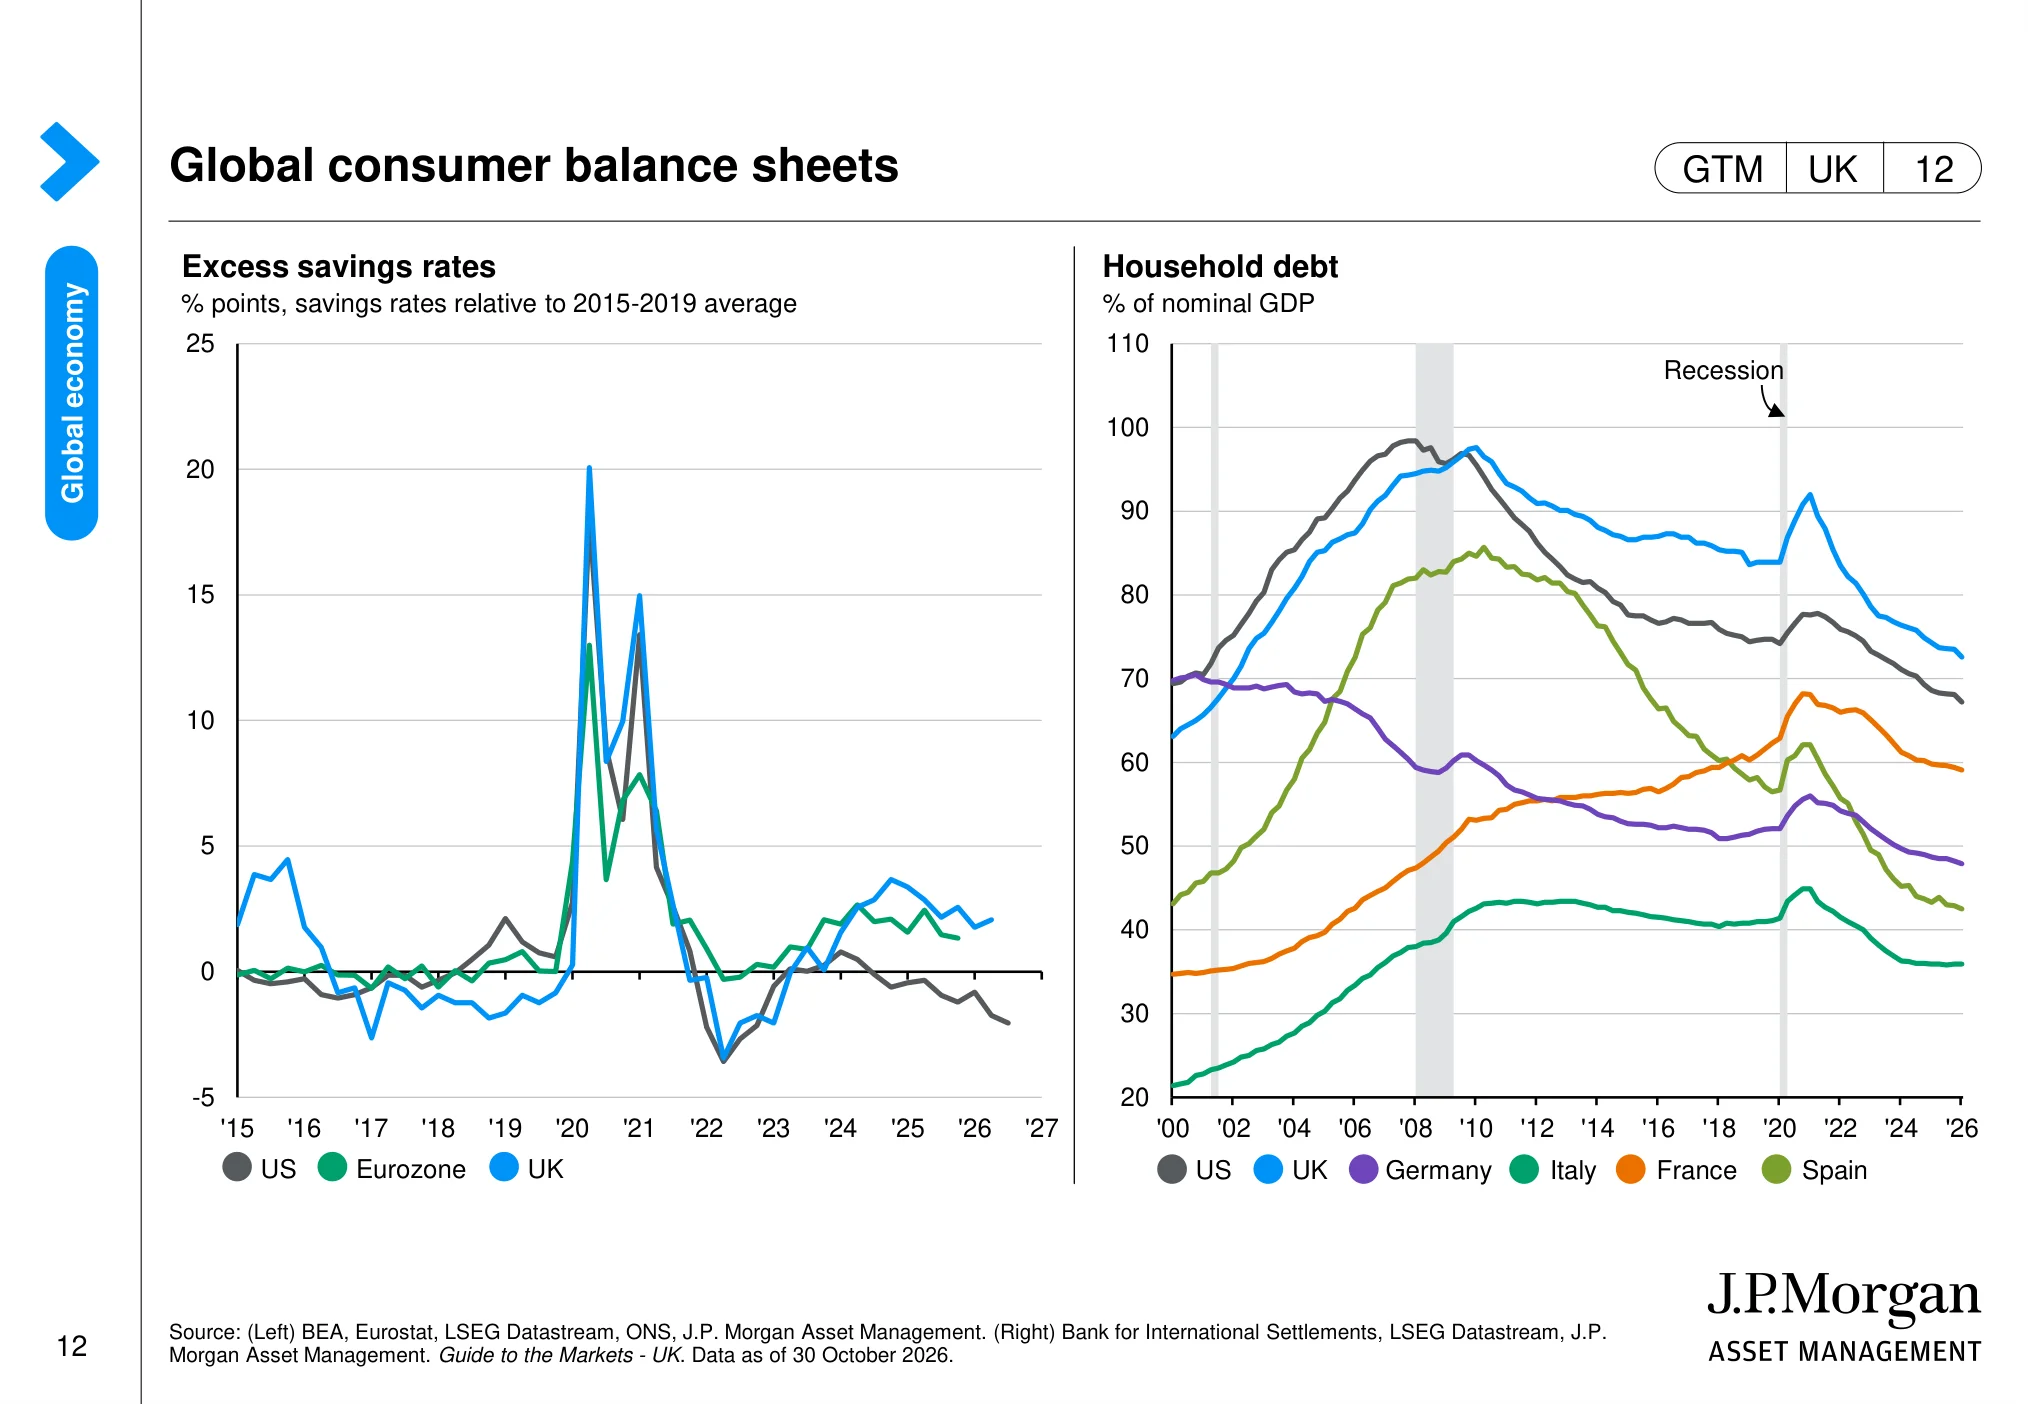
The chart: The charts track household excess savings relative to pre-pandemic norms and household debt as a share of GDP. They provide context on the financial capacity of consumers in the US and UK.
Why it matters: Consumer balance sheets influence the resilience of spending, which is a key driver of revenues for many listed companies.
US dollar and impact on returns (page 13)
 (opens in a new tab)
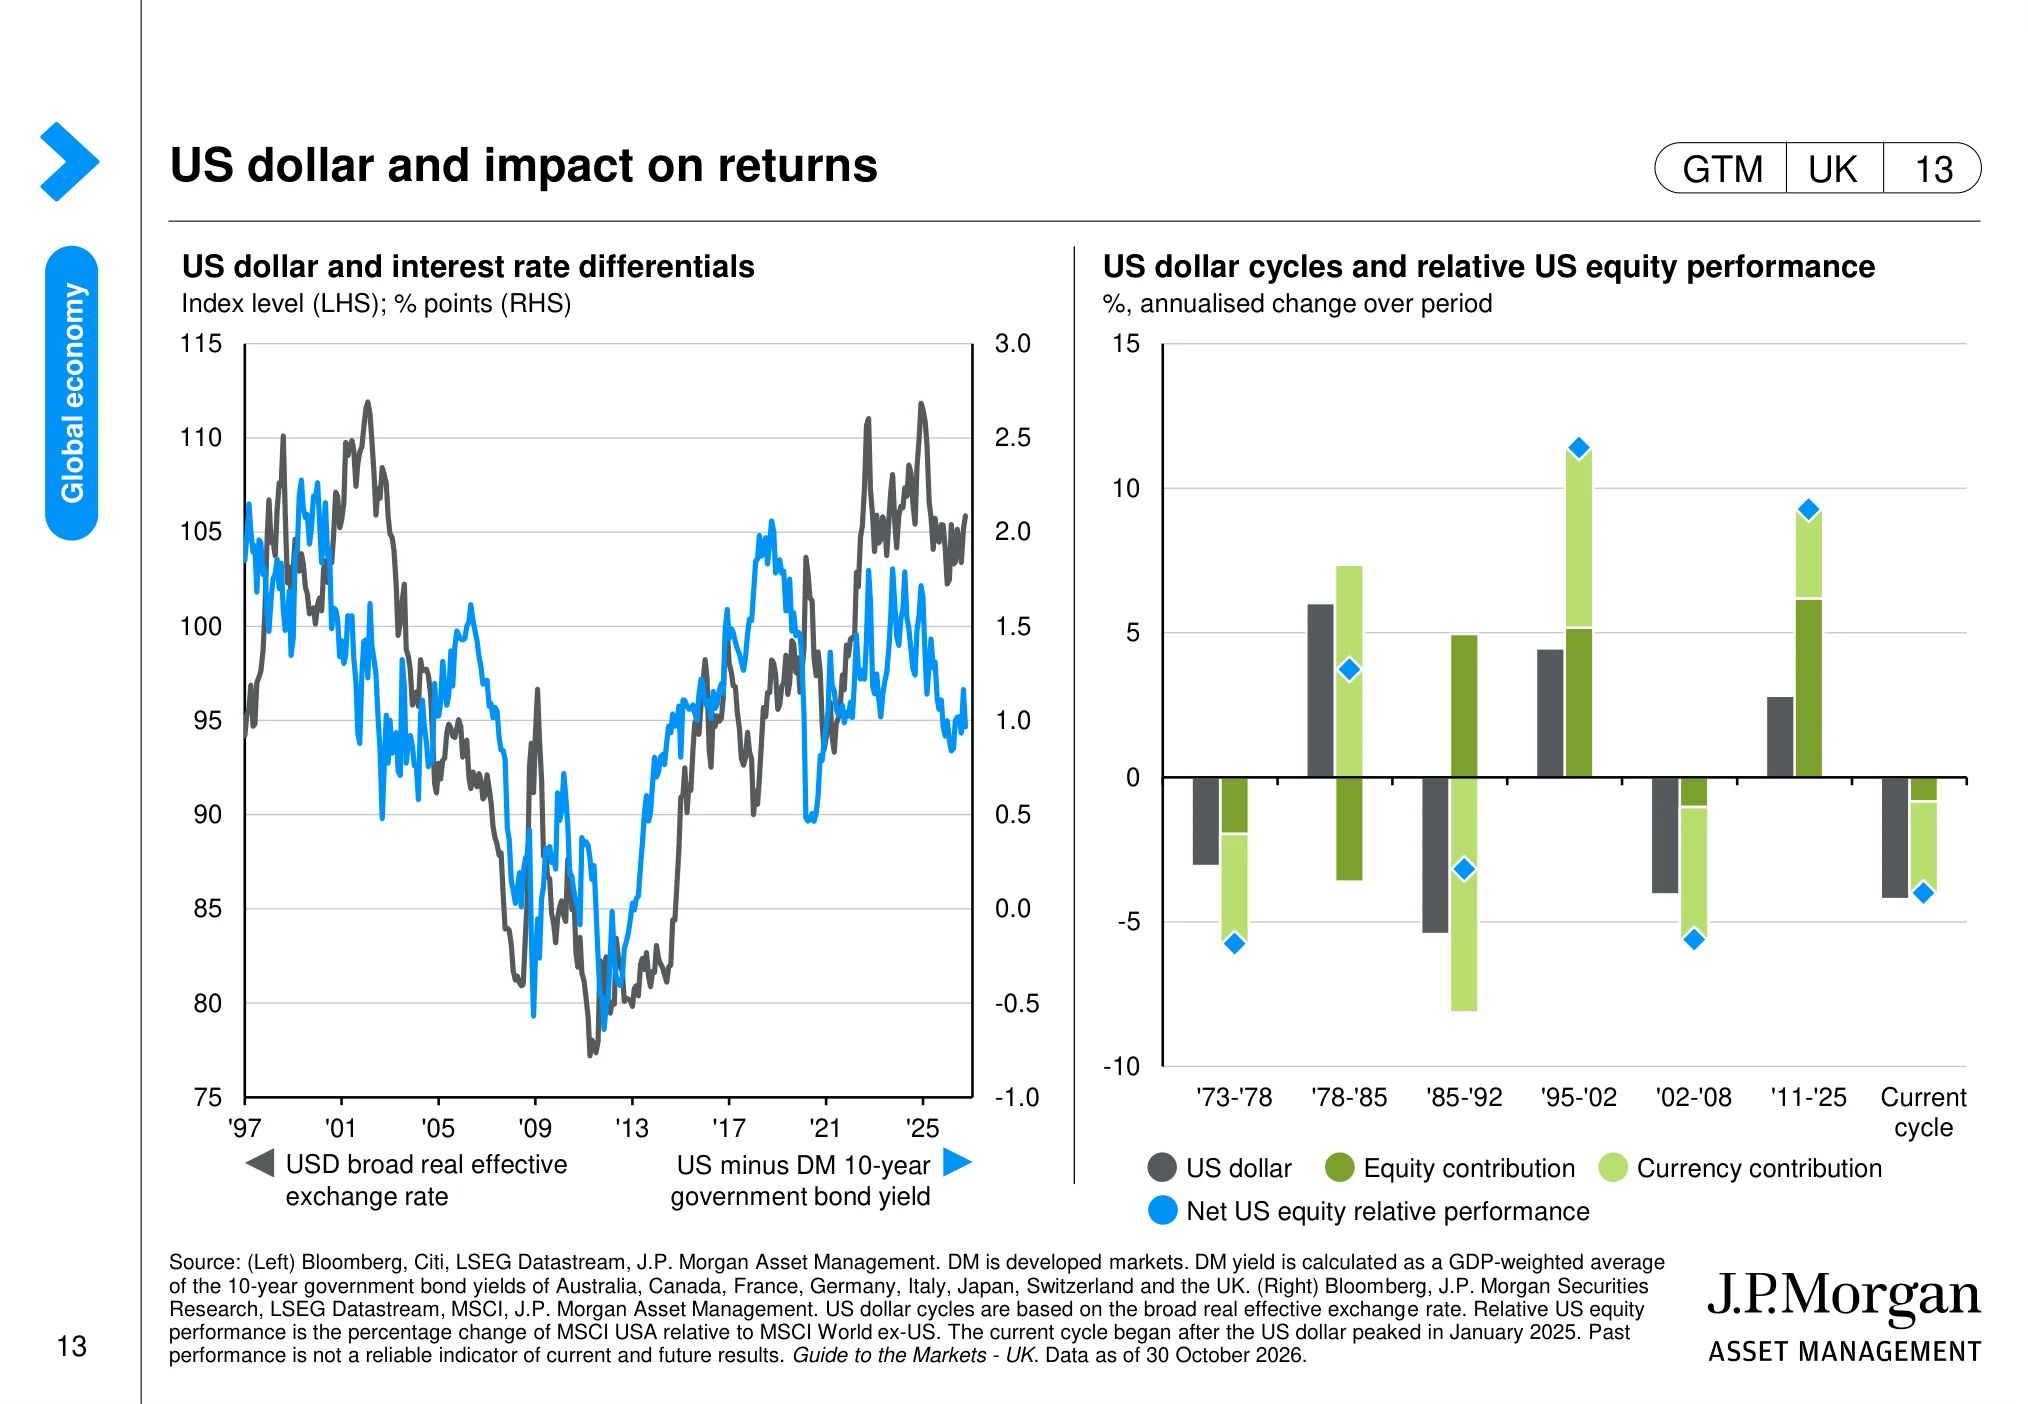
The chart: The page links the US dollar with interest-rate differentials and compares currency moves with relative US equity performance. It illustrates how currency translation can add to or detract from overseas investors’ returns.
Why it matters: For a UK investor holding US shares, sterling-dollar movements can materially change the return measured in pounds.
The US economy: jobs, inflation, the Fed and AI capex
The US is about 64% of global stock markets by value, according to J.P. Morgan's concentration chart later in this guide. That makes the health of the US economy the single biggest input for most global portfolios, including many UK pensions that hold global trackers.
US GDP and business surveys (page 15)
 (opens in a new tab)
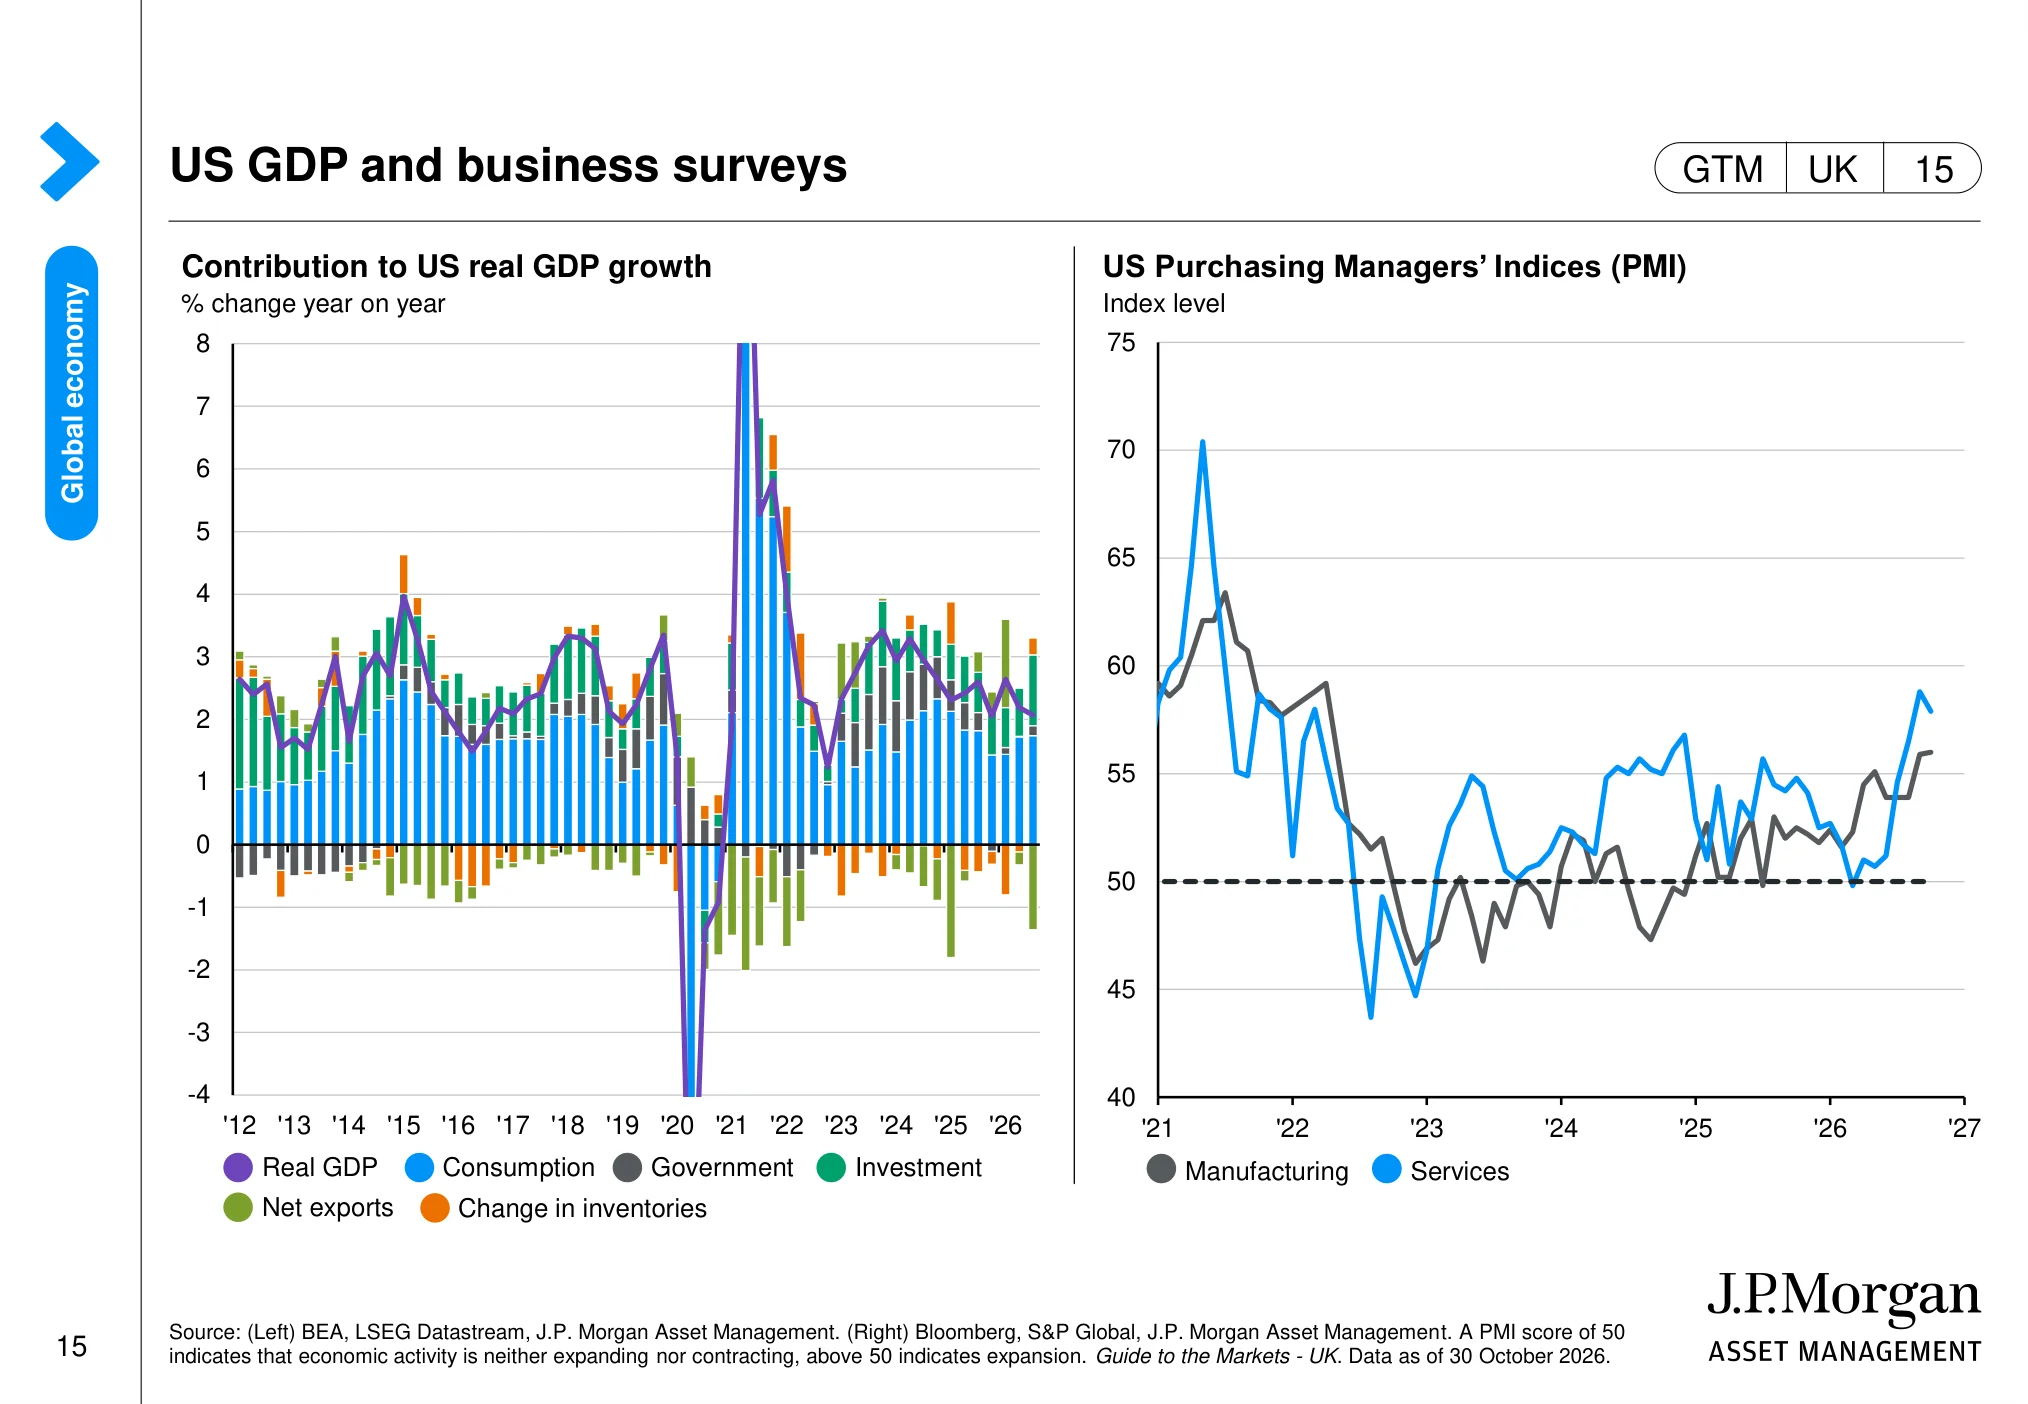
The chart: The charts break down US GDP growth by spending component and track US manufacturing and services PMIs. They show which parts of the economy are contributing to growth and whether business activity is expanding.
Why it matters: The composition of US growth helps investors judge the strength and sustainability of demand behind corporate earnings.
US investment and industrial production (page 17)
 (opens in a new tab)
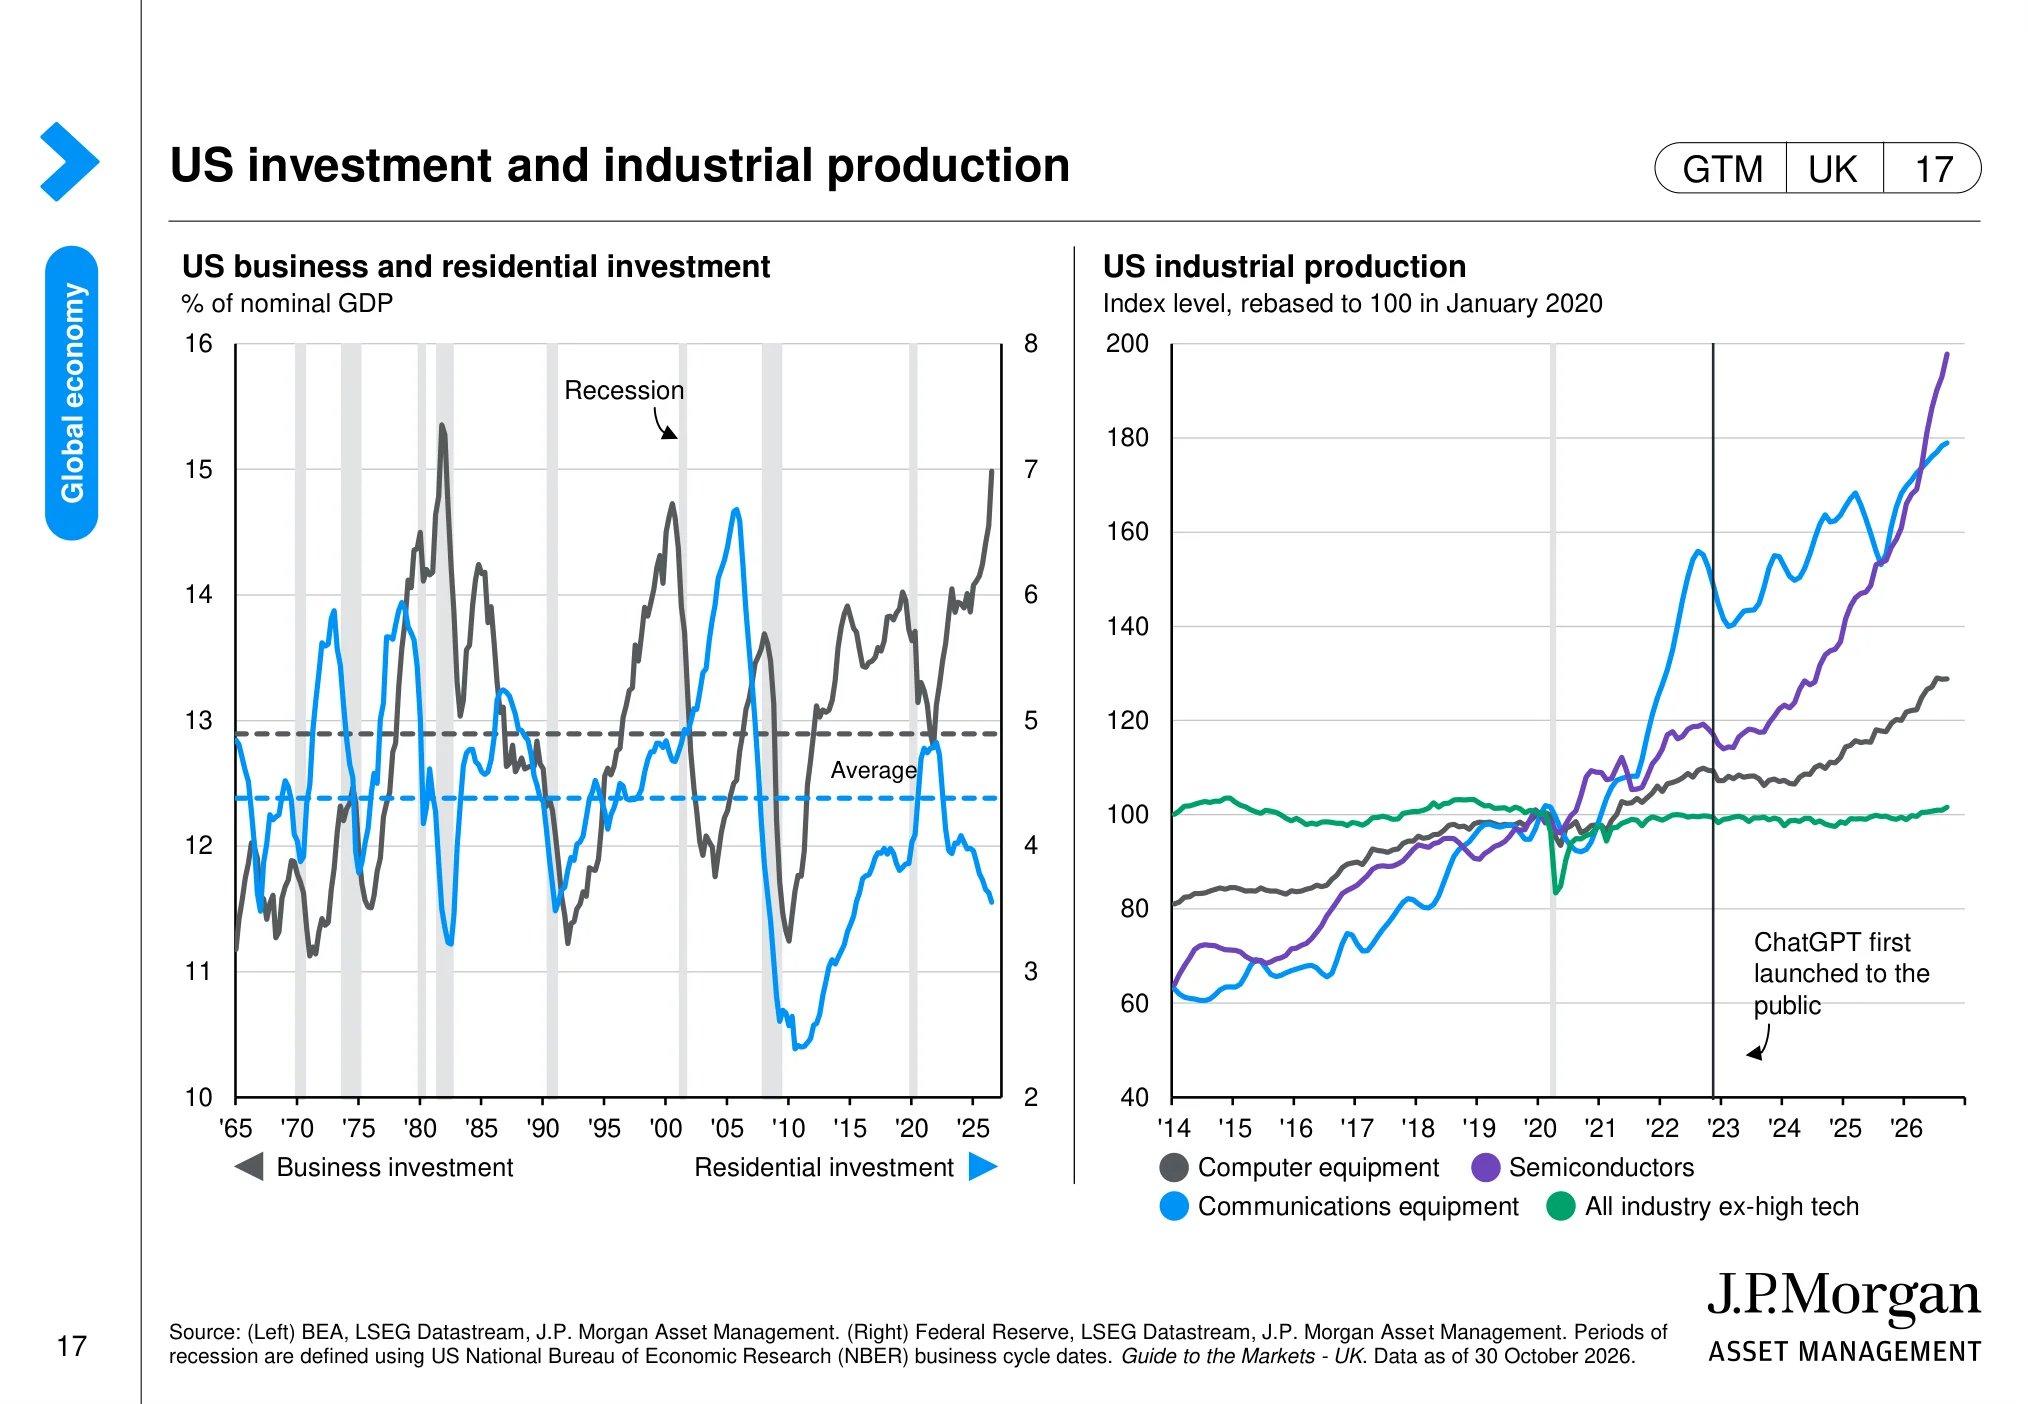
The chart: The page compares US business and residential investment over time and tracks industrial production in technology-related categories, including computers and semiconductors.
Why it matters: Investment in technology equipment and semiconductors is relevant to capital spending, supply chains and the earnings outlook for technology companies.
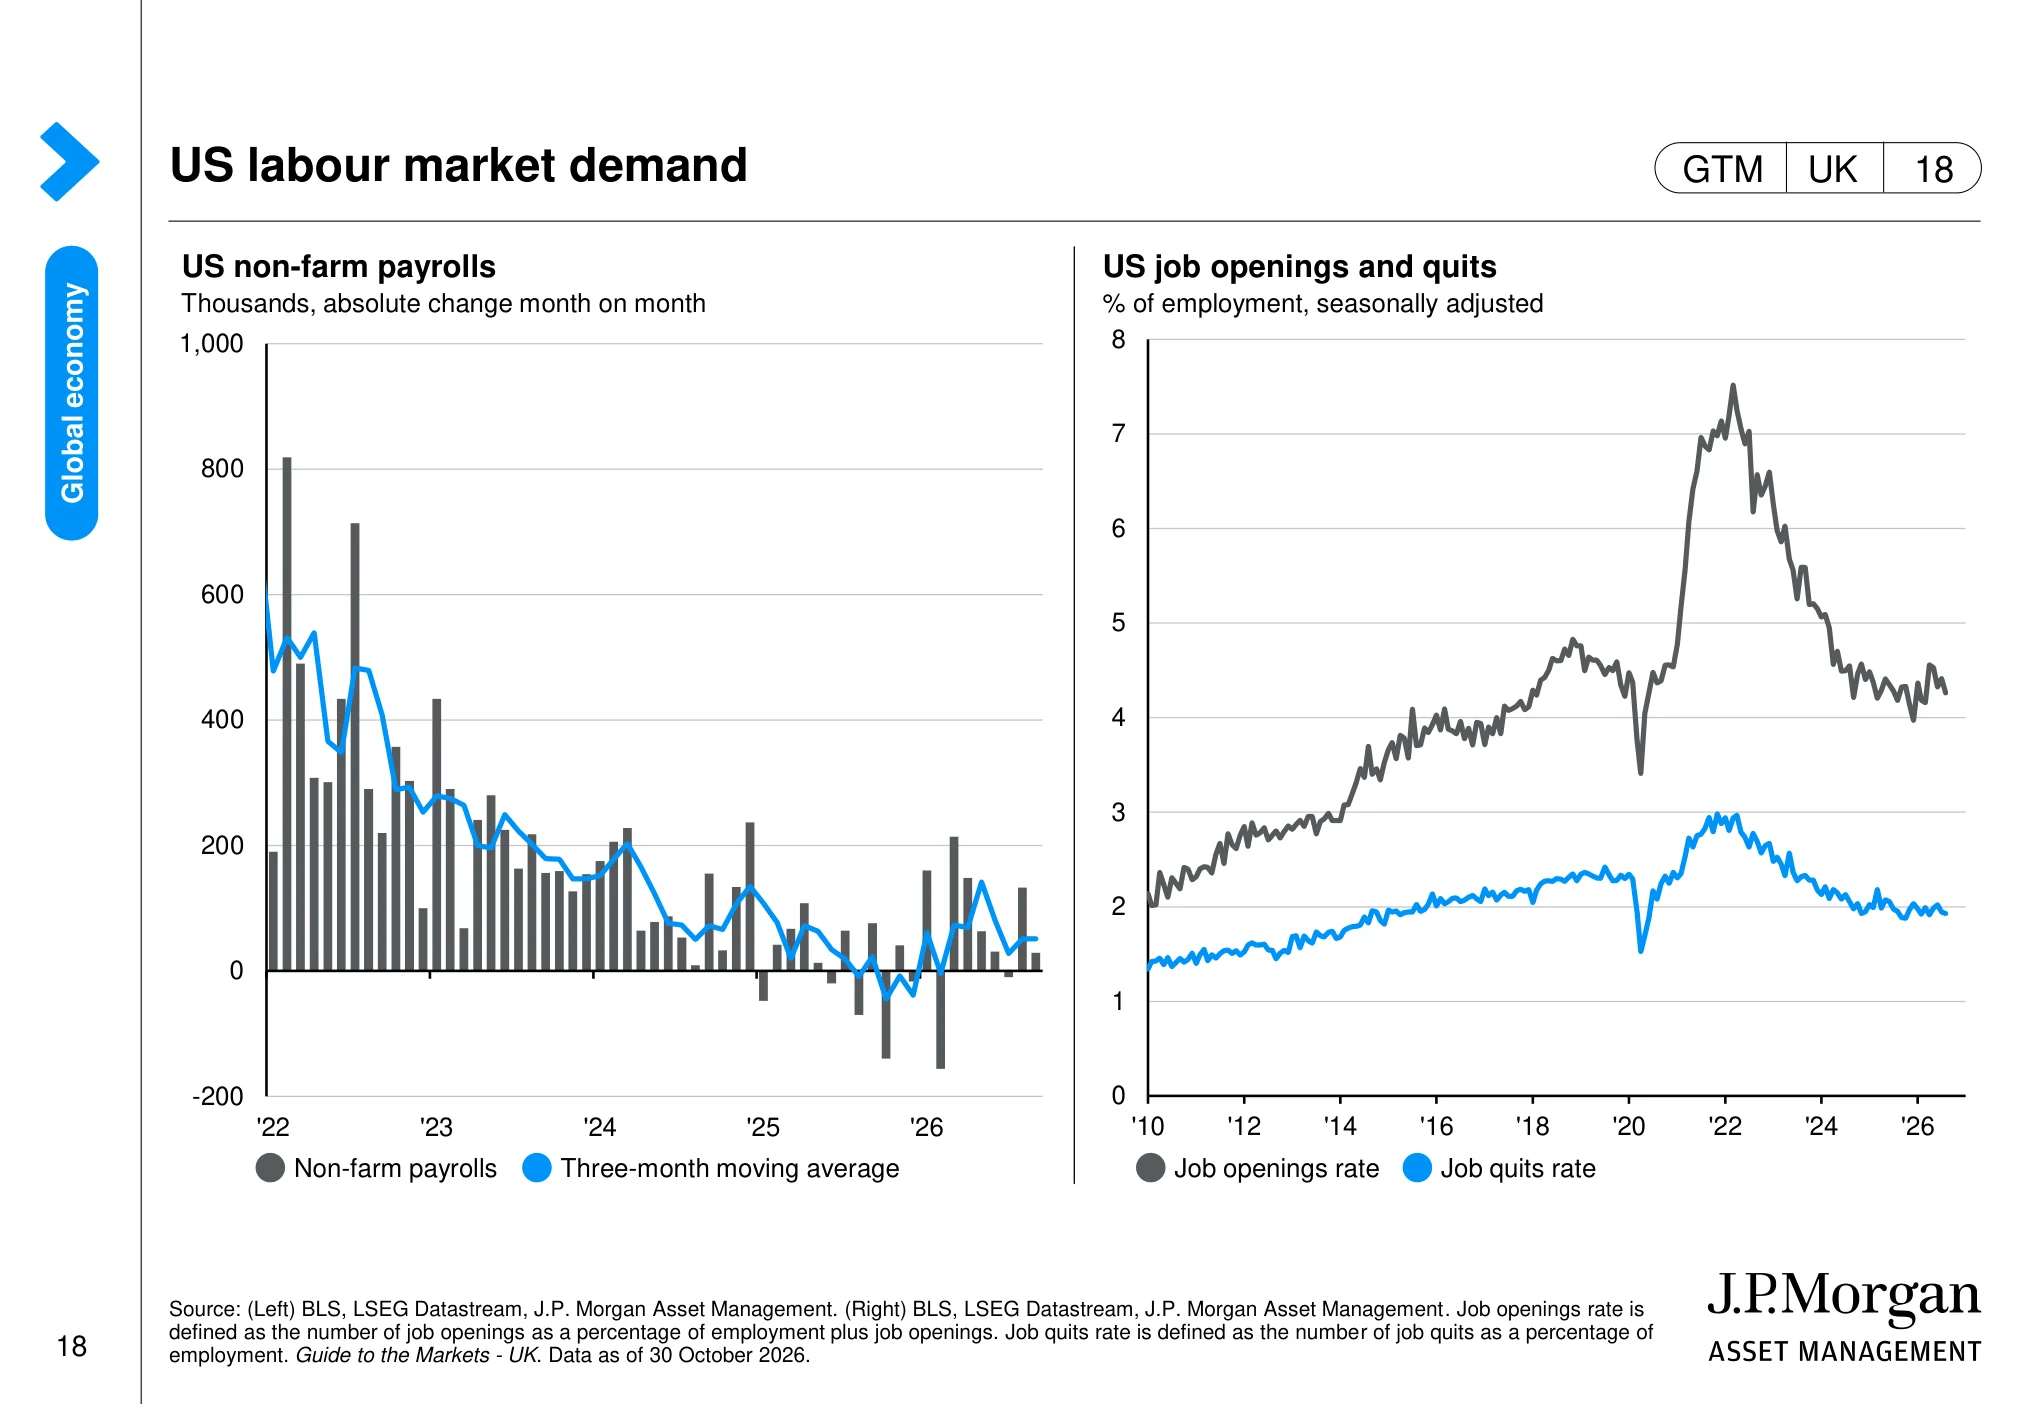
US labour market demand (page 18)
 (opens in a new tab)
The chart: The charts show monthly US payroll changes alongside job openings and the rate at which workers quit their jobs. Together they indicate the pace of hiring and the tightness of the labour market.
Why it matters: Labour-market conditions affect consumer income, wage costs and the Federal Reserve’s assessment of inflation risks.
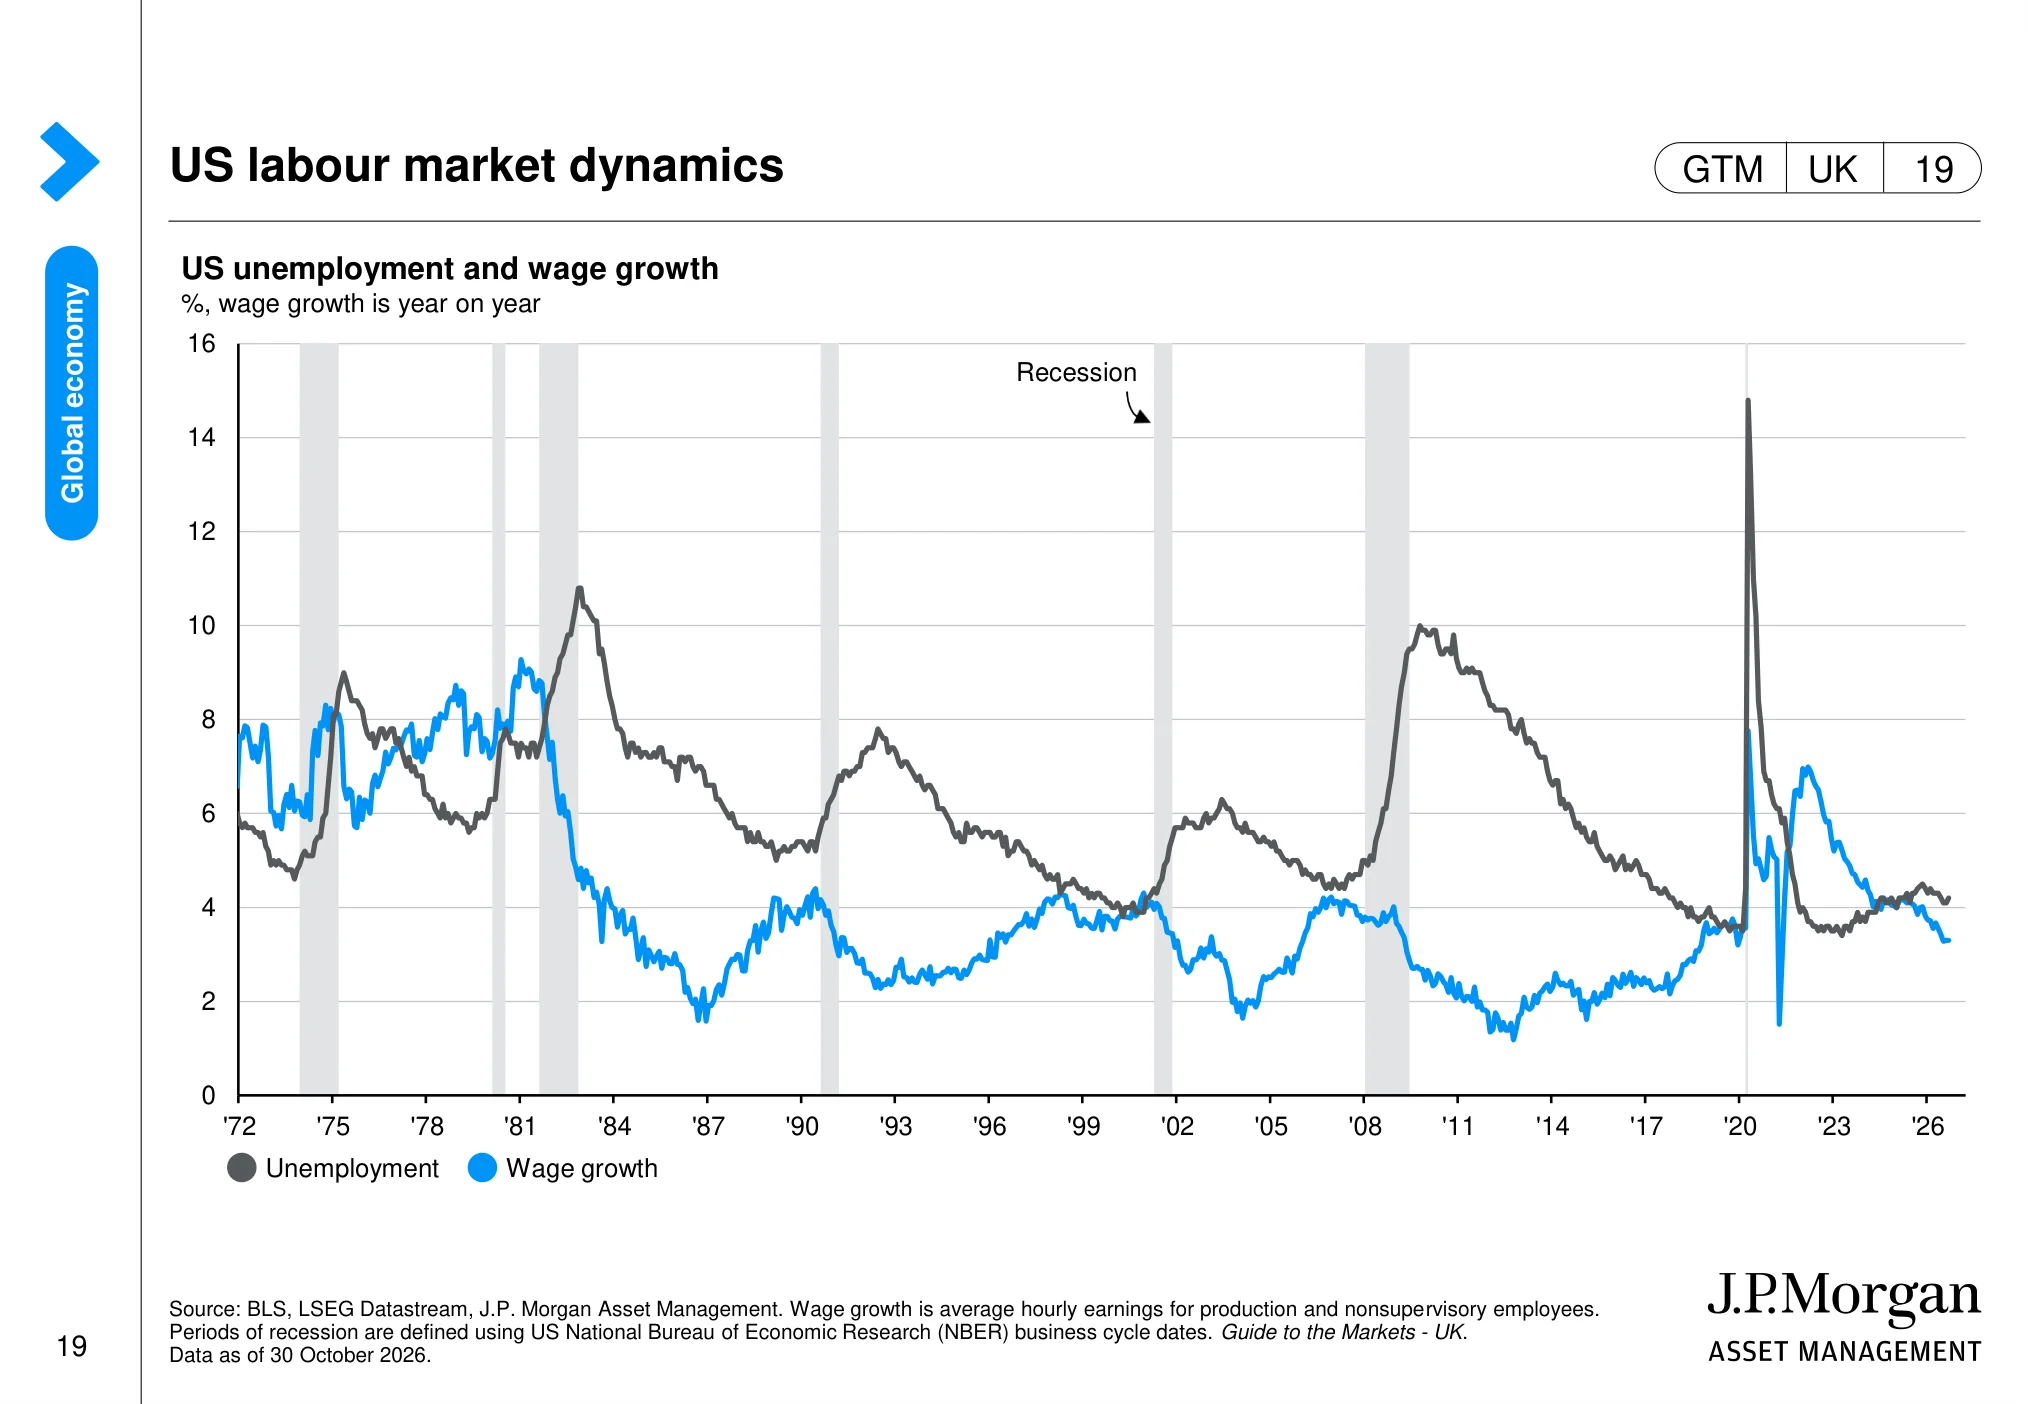
US labour market dynamics (page 19)
 (opens in a new tab)
The chart: The chart compares US unemployment with wage growth over several decades and marks recession periods. It places current labour-market conditions in a longer historical context.
Why it matters: Wage growth can support consumption but also raise business costs, making it important for both earnings and inflation.
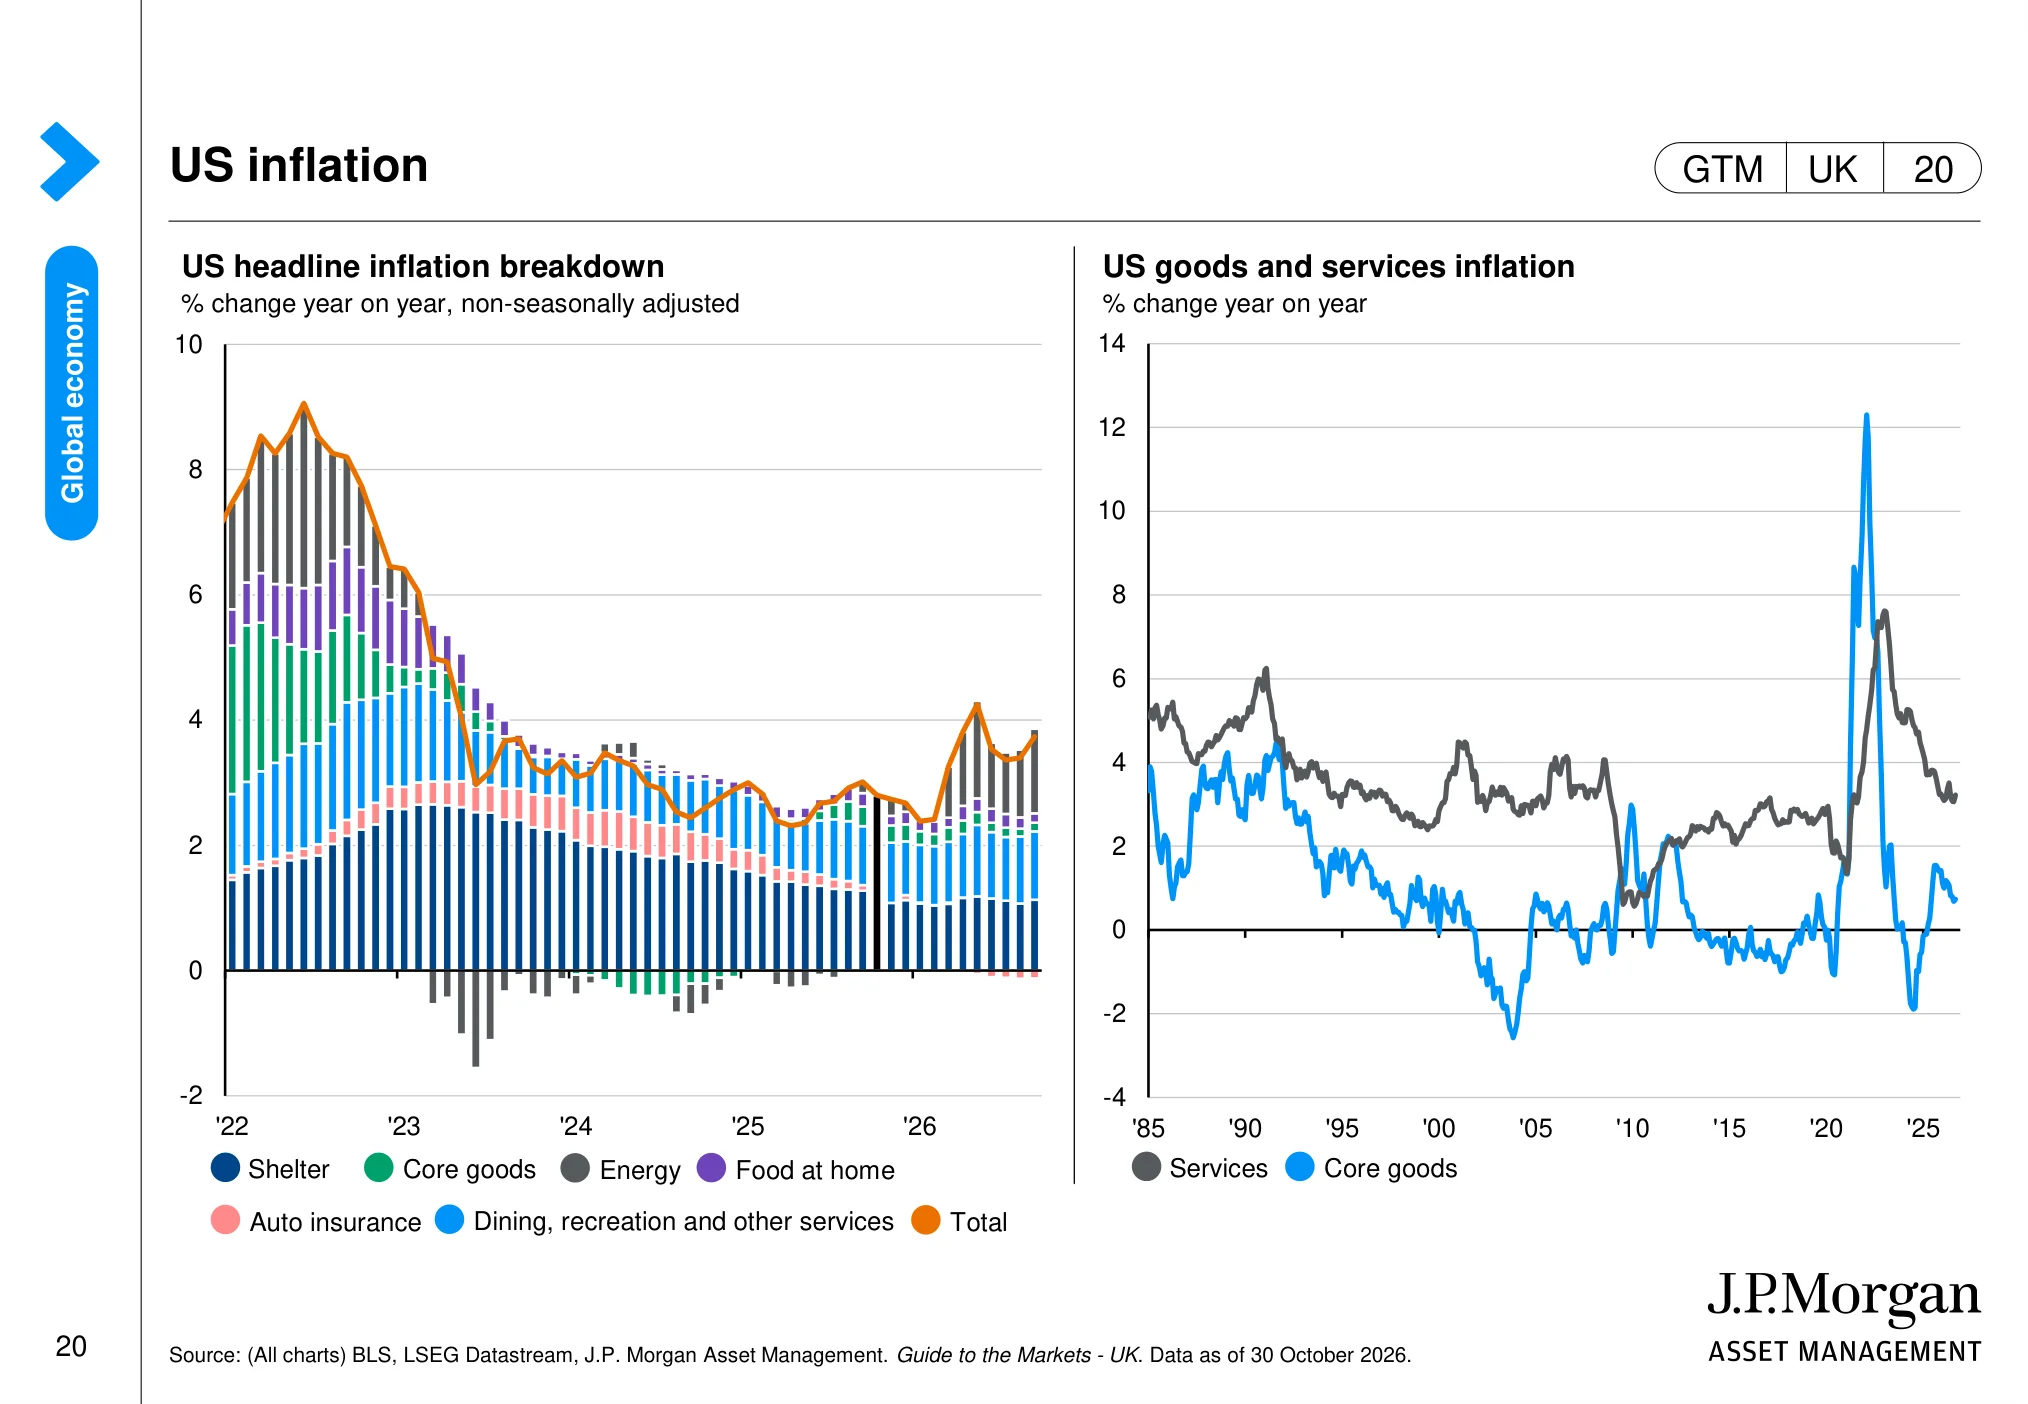
US inflation (page 20)
 (opens in a new tab)
The chart: The charts break US inflation into major components and compare goods and services inflation over the long term. They help distinguish broad price pressure from movements in individual categories.
Why it matters: The persistence of services inflation can influence the timing of rate cuts and therefore equity-market valuations.
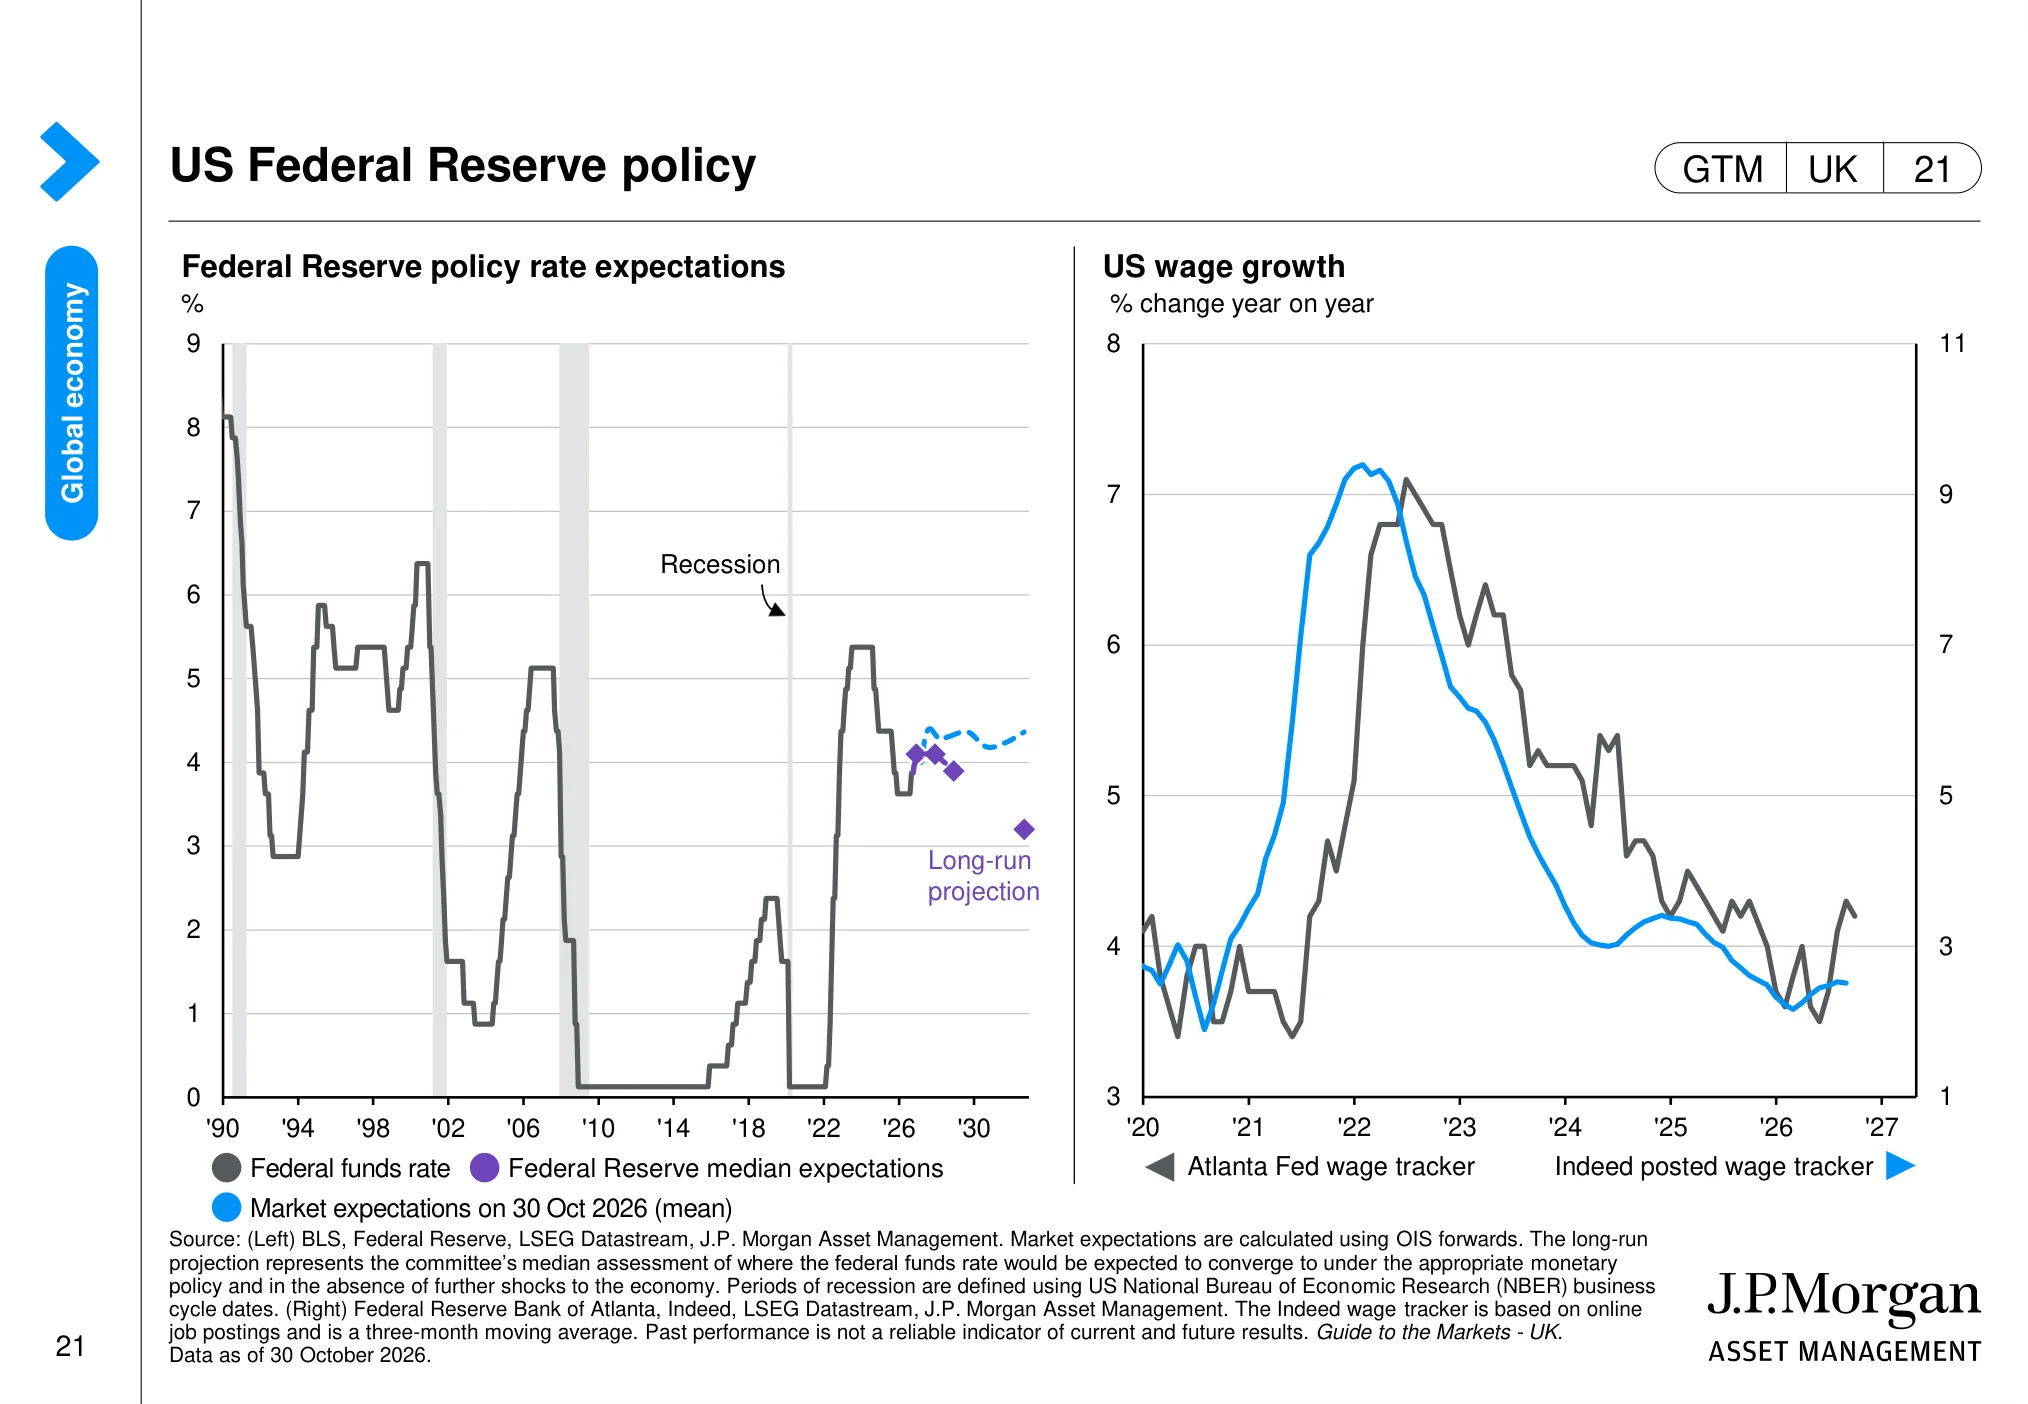
US Federal Reserve policy (page 21)
 (opens in a new tab)
The chart: The page shows the Federal Reserve policy rate, its long-run projection and market expectations, alongside measures of US wage growth.
Why it matters: The expected path of US rates is a major input into bond yields, equity discount rates and the relative appeal of cash versus shares.
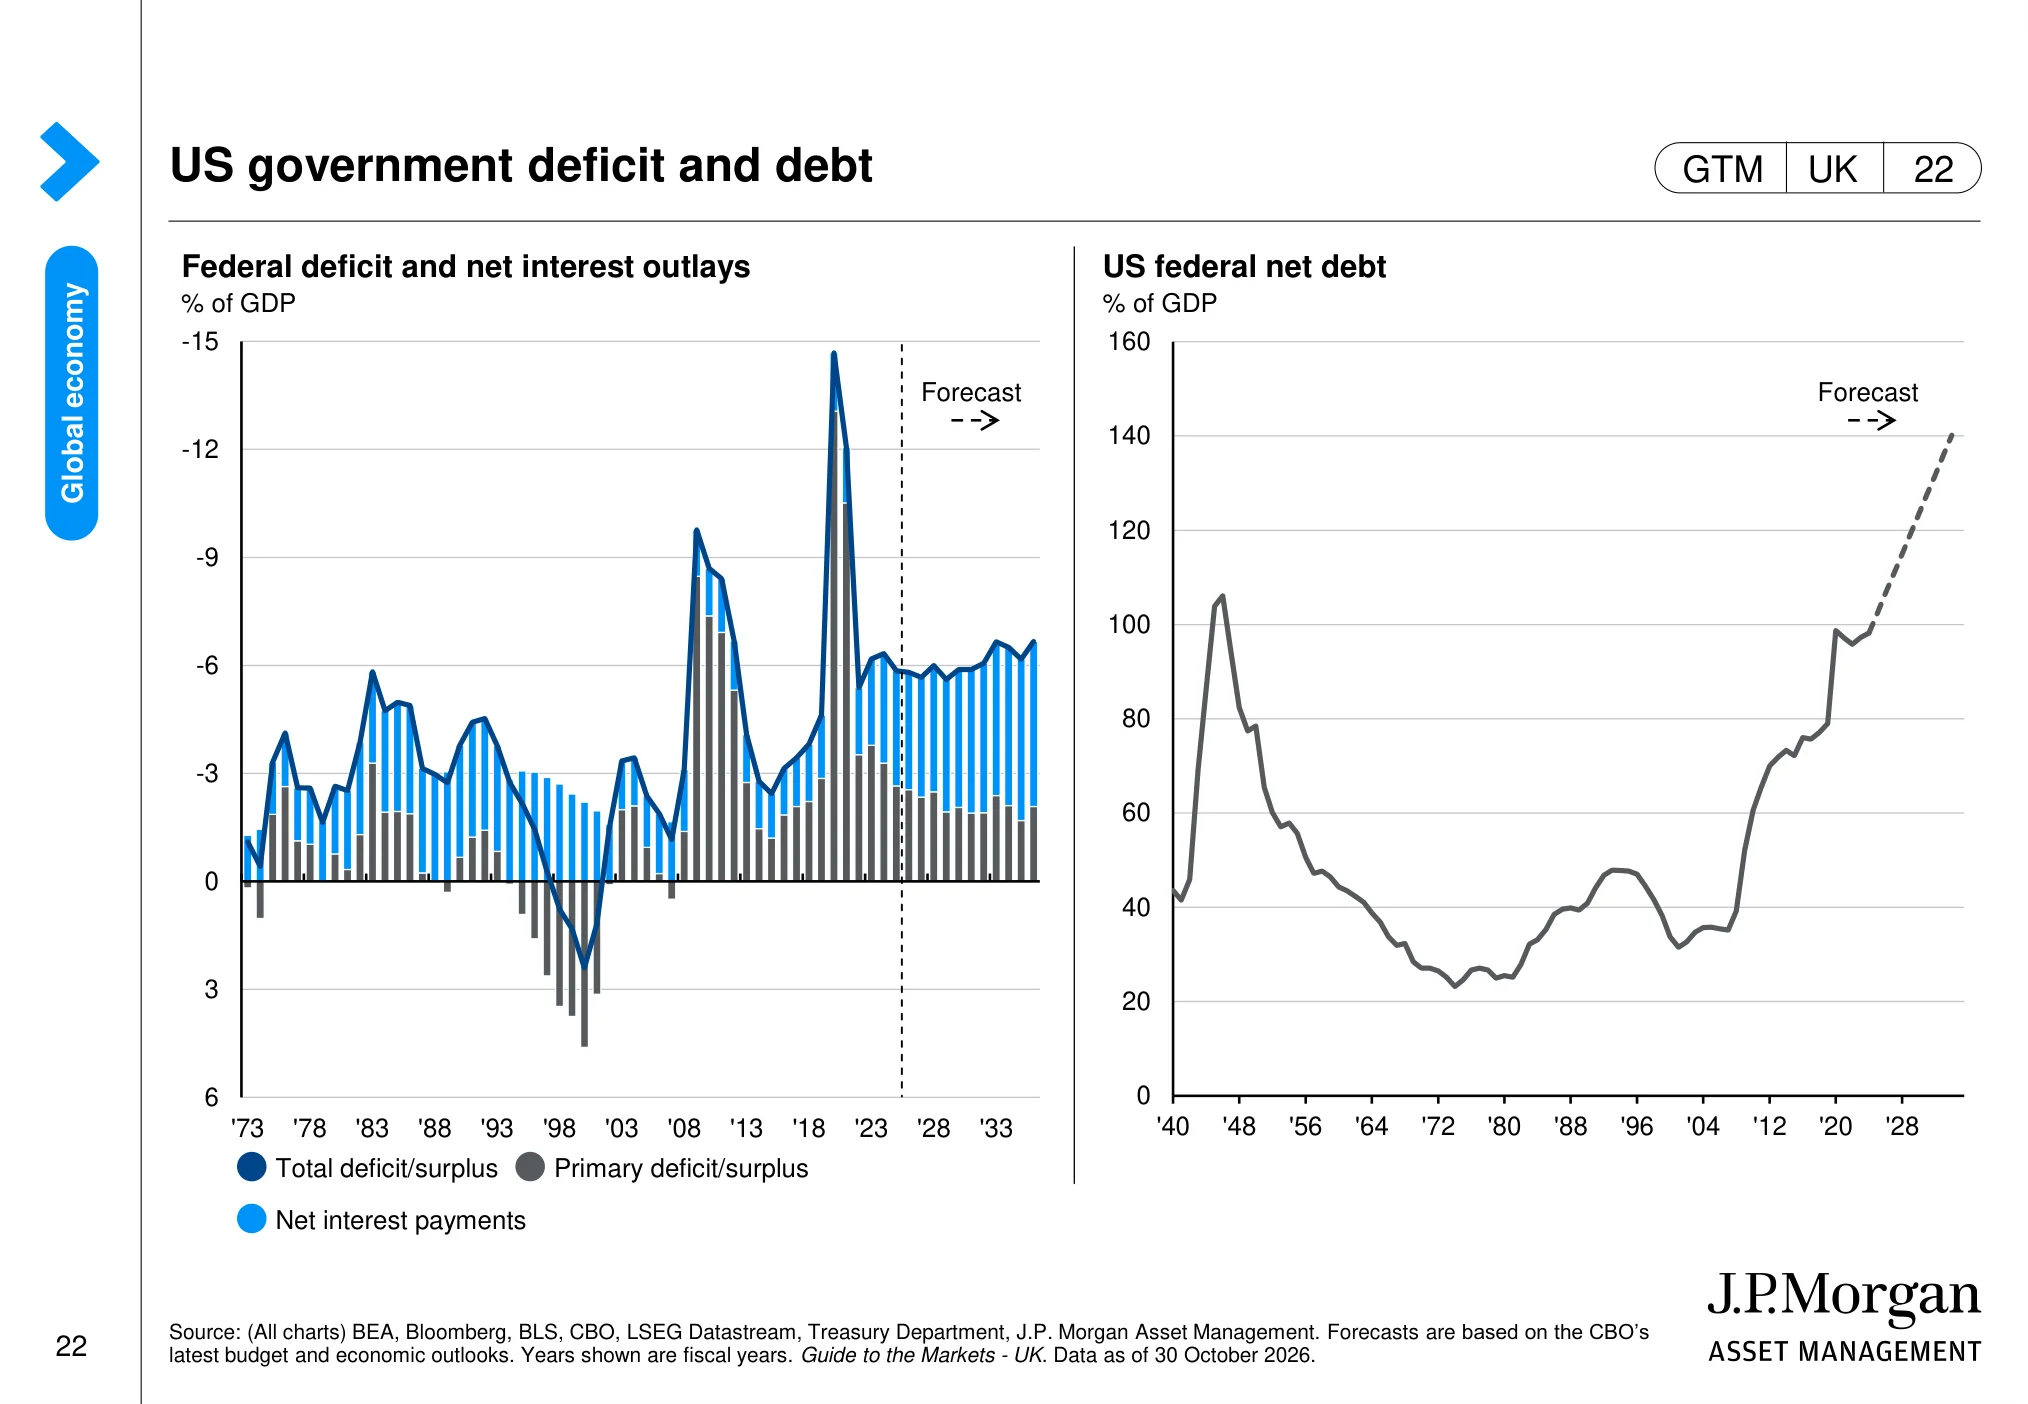
US government deficit and debt (page 22)
 (opens in a new tab)
The chart: The charts show the US federal deficit, net interest costs and the projected path of federal net debt. The fiscal outlook is presented against a long historical backdrop.
Why it matters: Large deficits and rising interest costs can affect Treasury supply, market yields and the financial conditions facing companies.
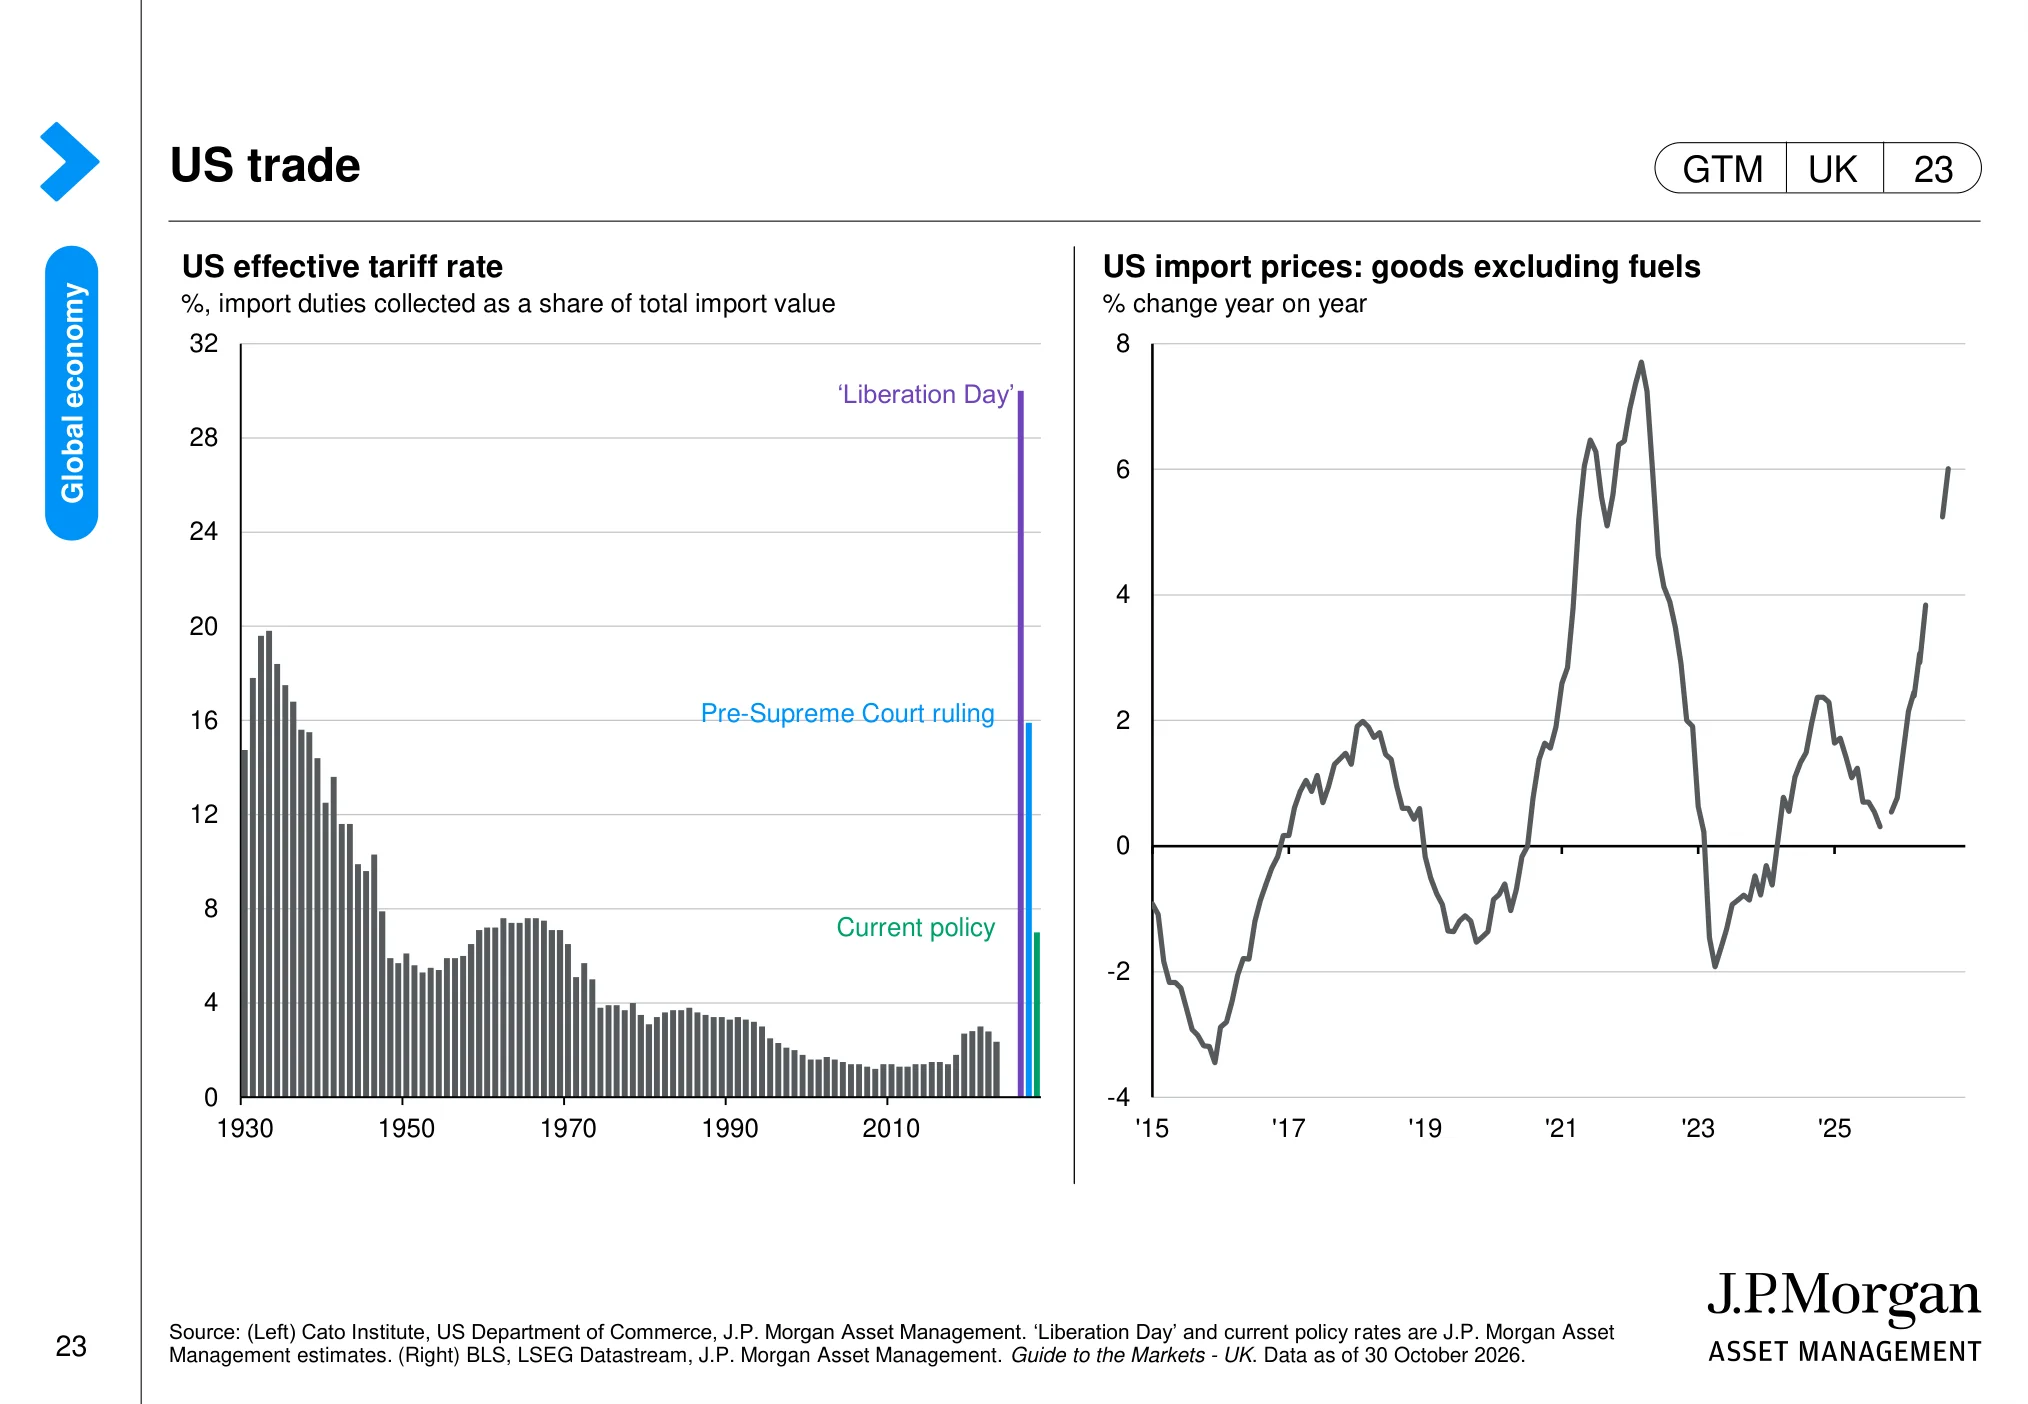
US trade (page 23)
 (opens in a new tab)
The chart: The page tracks the US effective tariff rate and import prices for goods excluding fuels. It provides a view of how trade-policy changes may pass through to the cost of imported products.
Why it matters: Tariffs can affect company input costs, consumer prices, supply chains and profit margins.
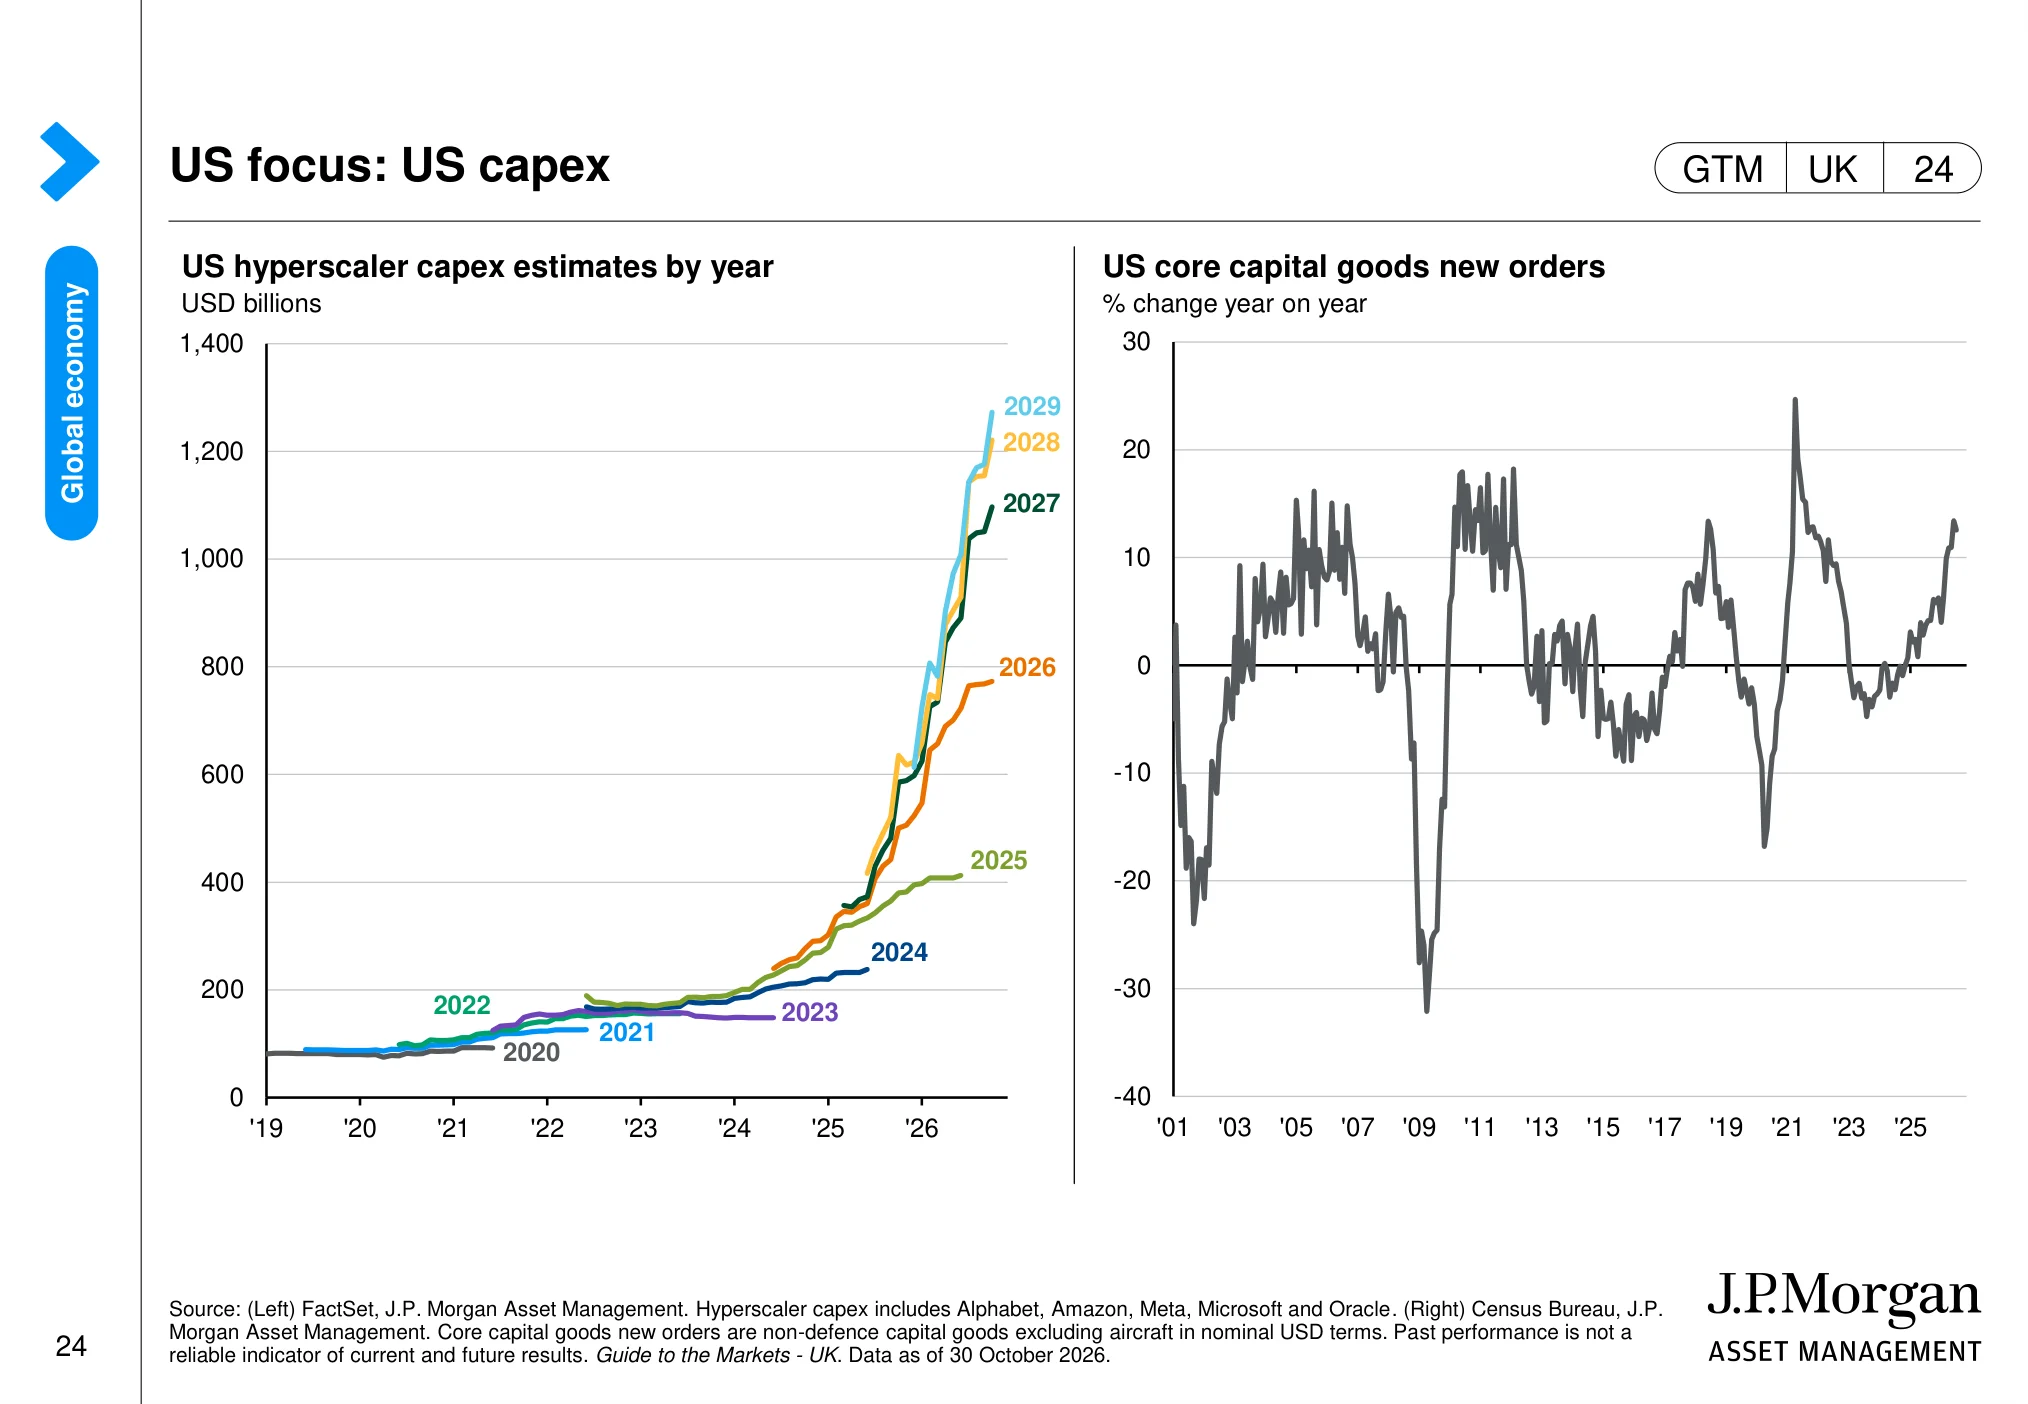
US focus: US capex (page 24)
 (opens in a new tab)
The chart: The charts focus on US hyperscaler capital expenditure and core capital-goods orders. They provide evidence on investment spending linked to data centres, cloud infrastructure and broader business equipment.
Why it matters: AI-related investment is an important source of demand for technology hardware, infrastructure suppliers and selected industrial companies.
The UK economy: housing, wages, inflation and the Budget
The UK backdrop matters most for domestically focused companies, the mid-cap FTSE 250 and anyone whose costs, salary and mortgage are in pounds. It also shapes what the Bank of England does next, and therefore the return on cash and gilts.
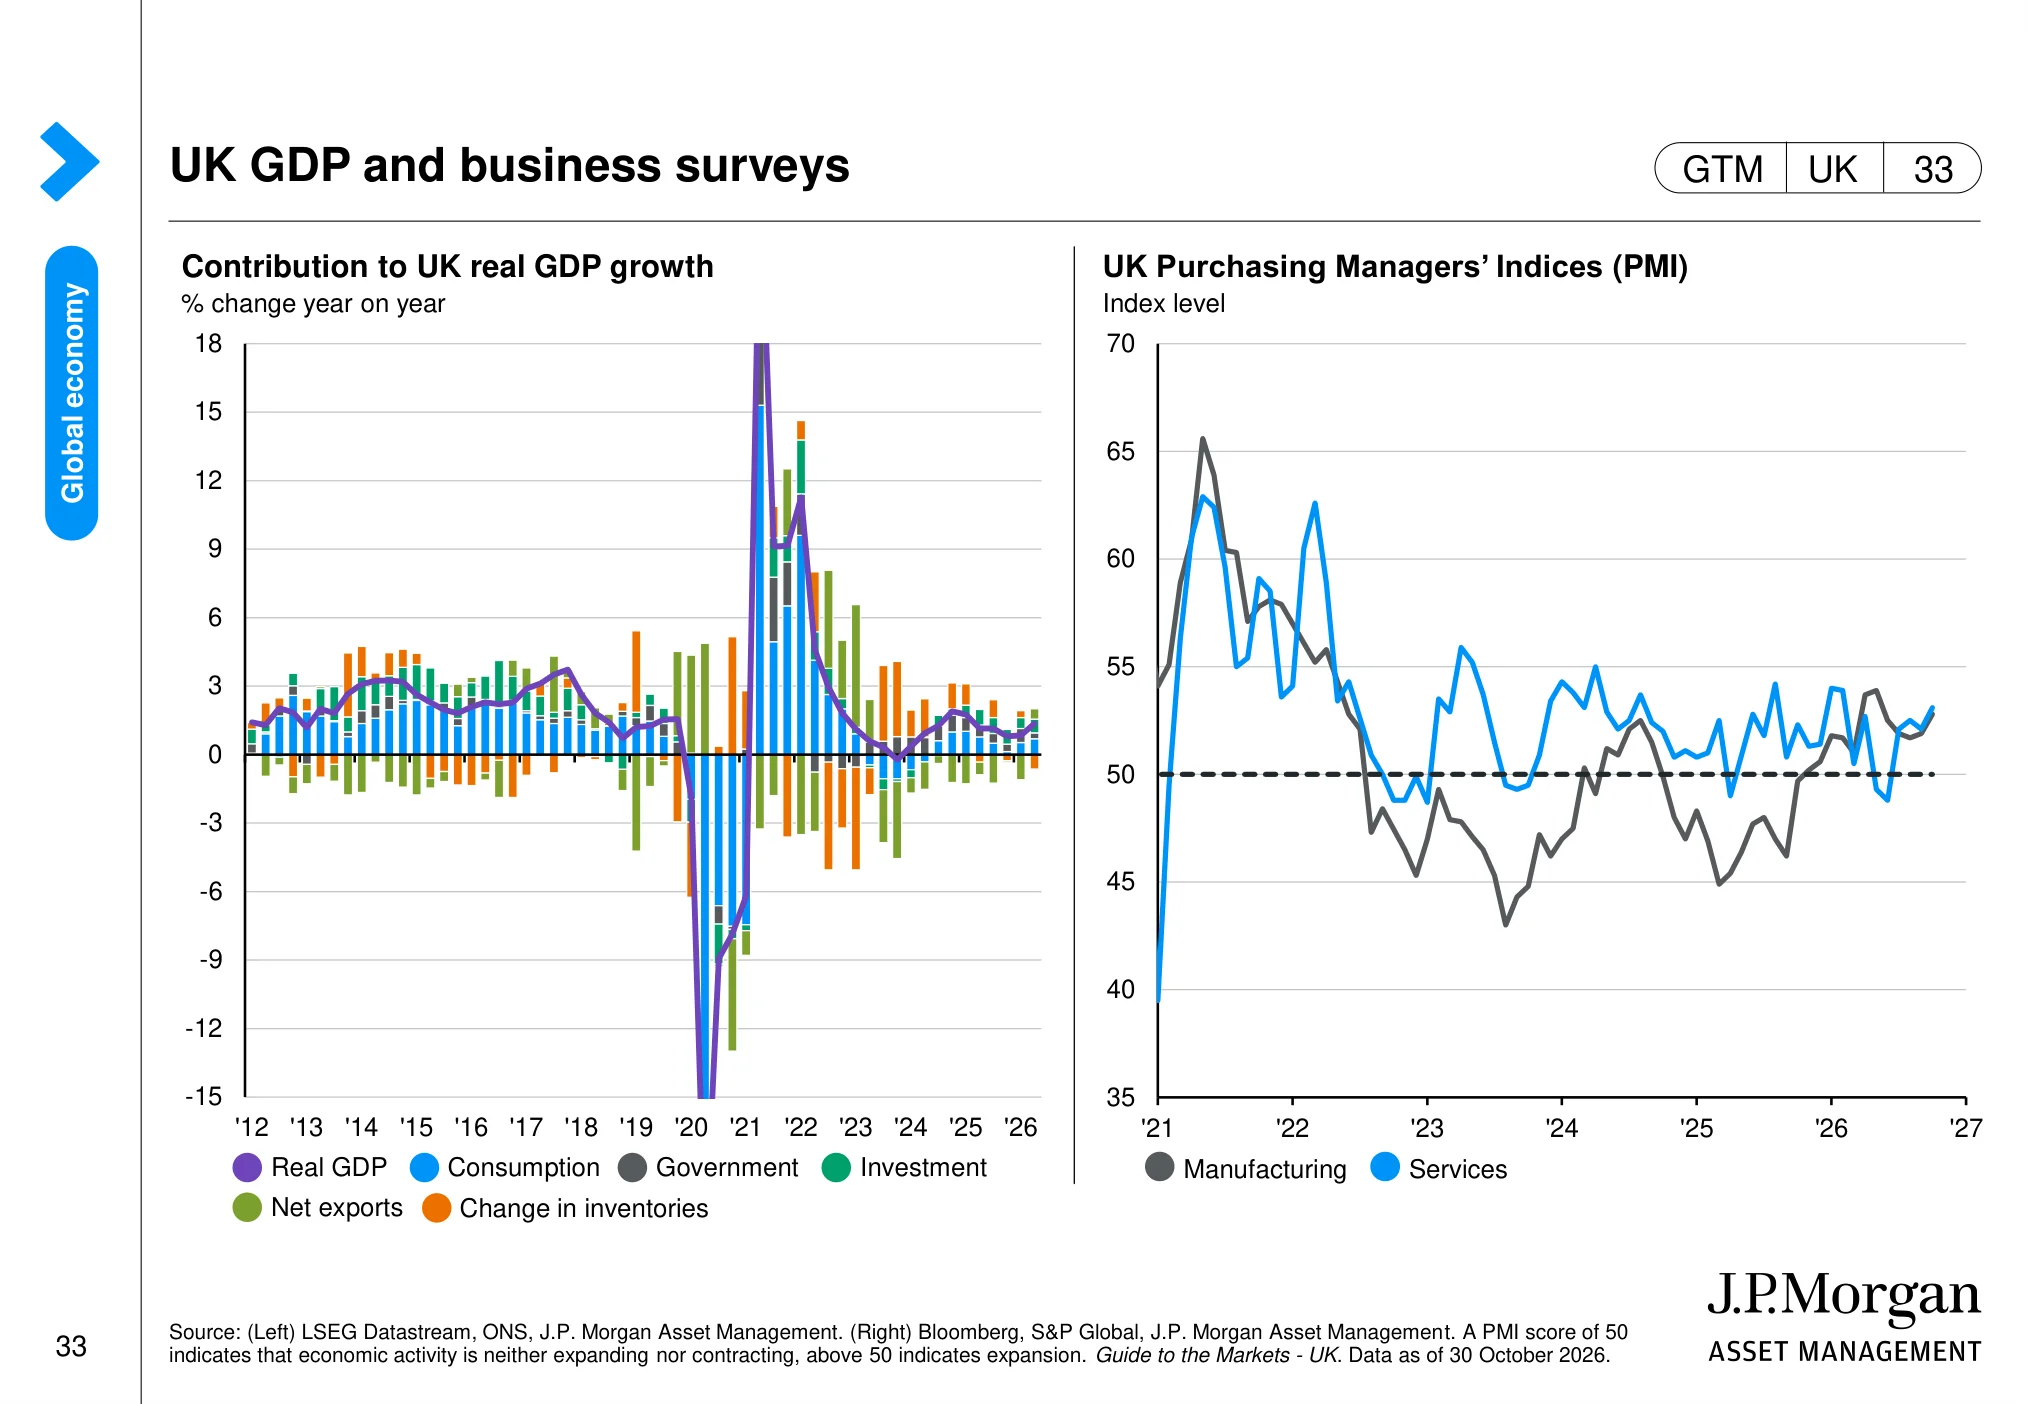
UK GDP and business surveys (page 33)
 (opens in a new tab)
The chart: The charts show the contribution of different components to UK GDP growth and the UK manufacturing and services PMIs. A PMI reading above 50 indicates expansion.
Why it matters: The UK growth mix and business surveys help assess the trading environment for domestically exposed UK companies.
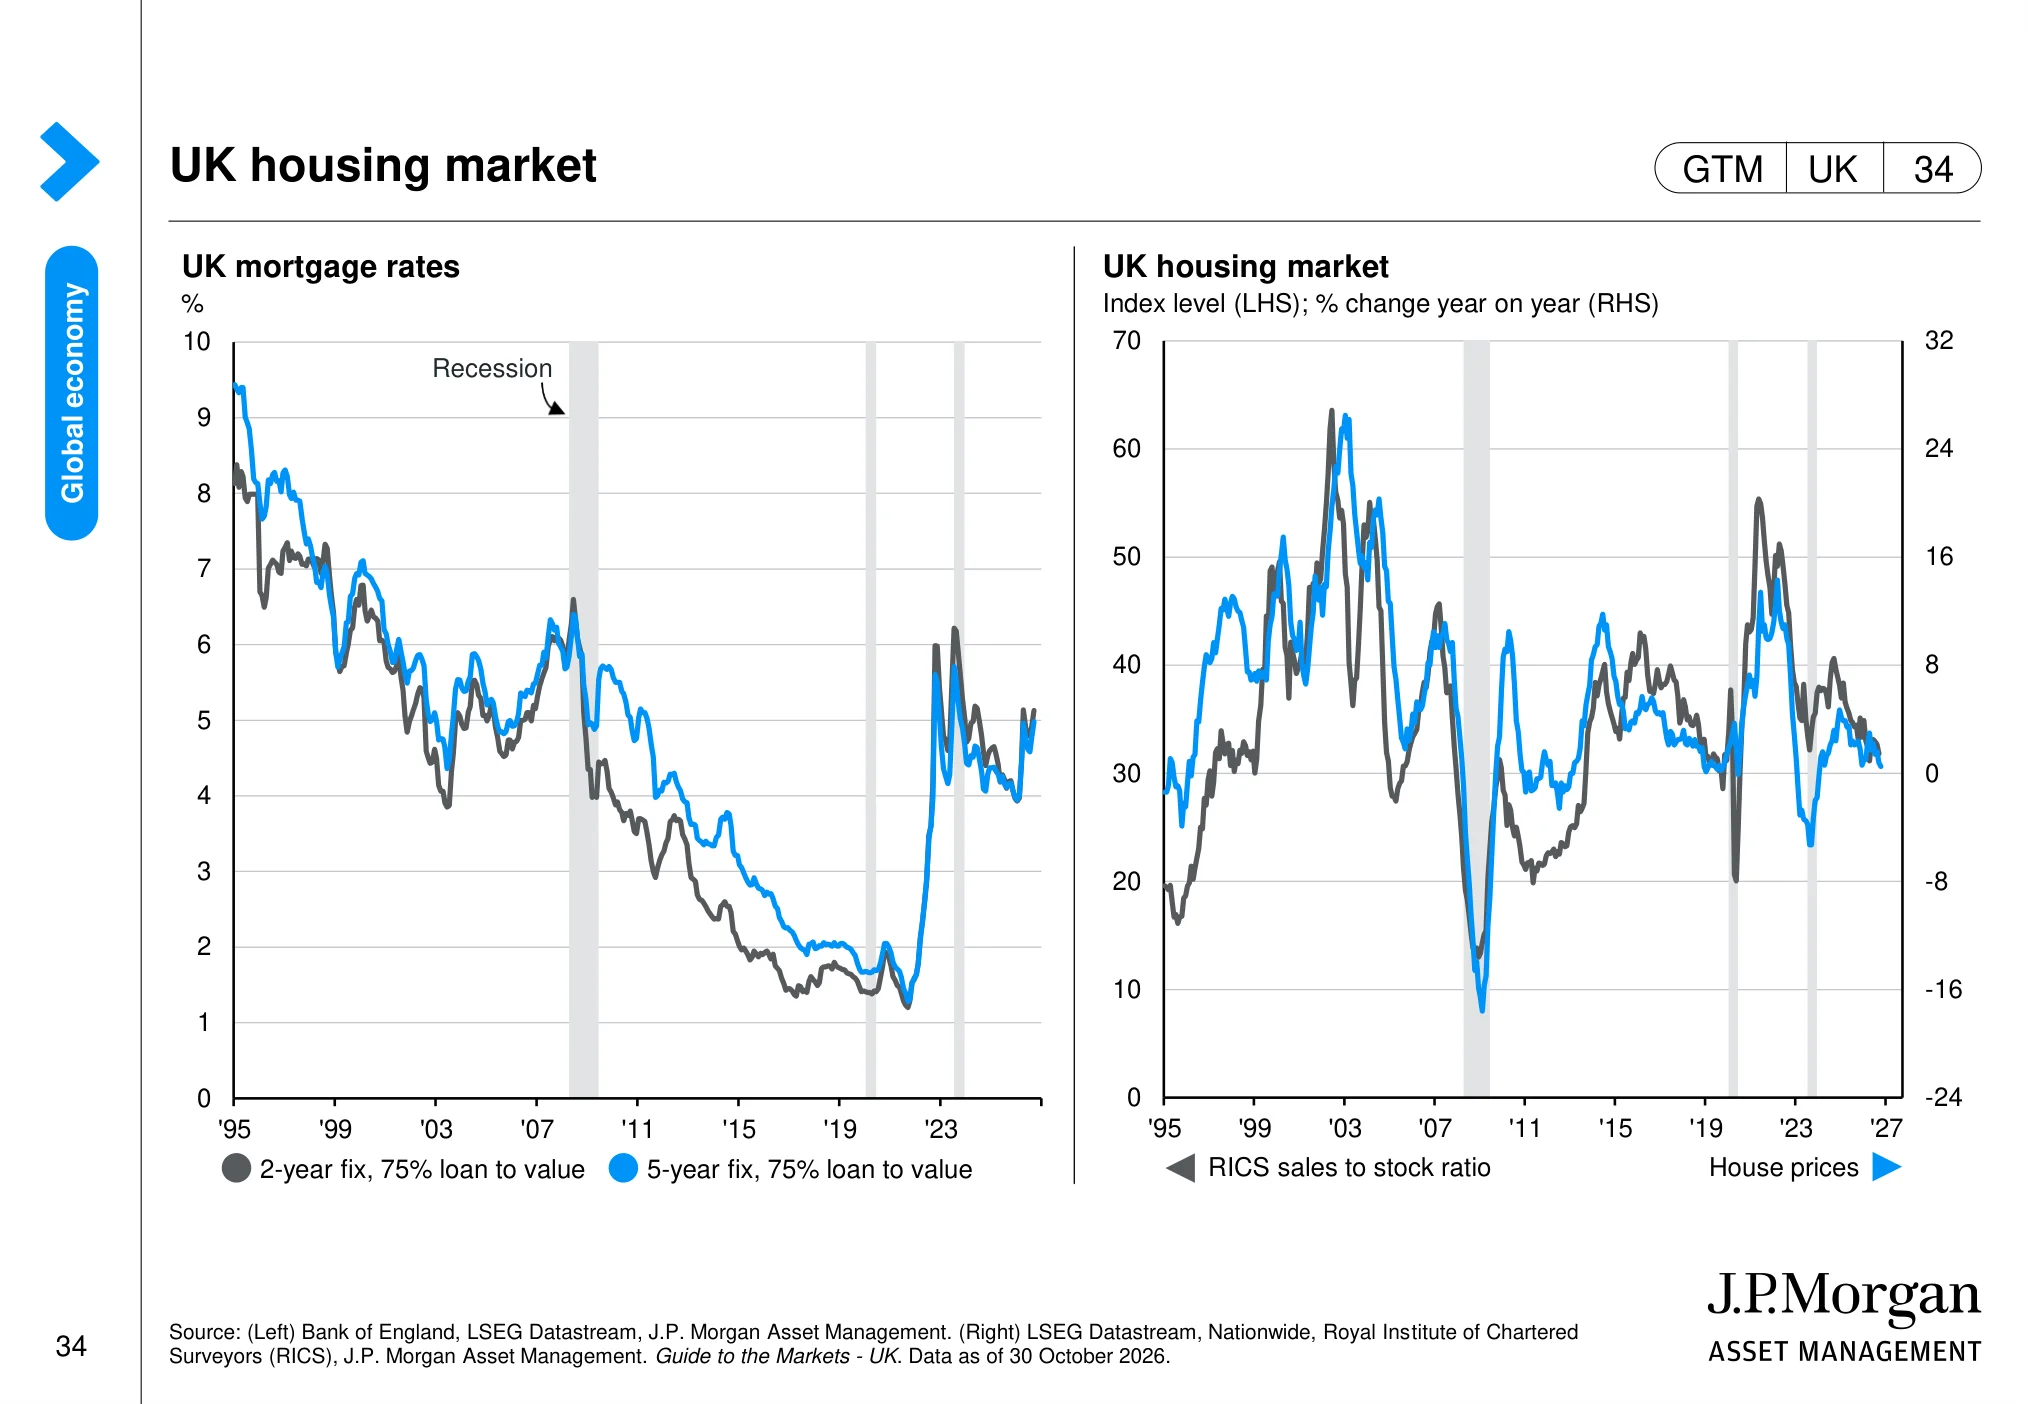
UK housing market (page 34)
 (opens in a new tab)
The chart: The page tracks UK mortgage rates and measures of housing-market activity and prices. It places current housing conditions in the context of the longer cycle.
Why it matters: Housing affordability and activity influence consumer confidence, household spending and earnings in housing-linked sectors.
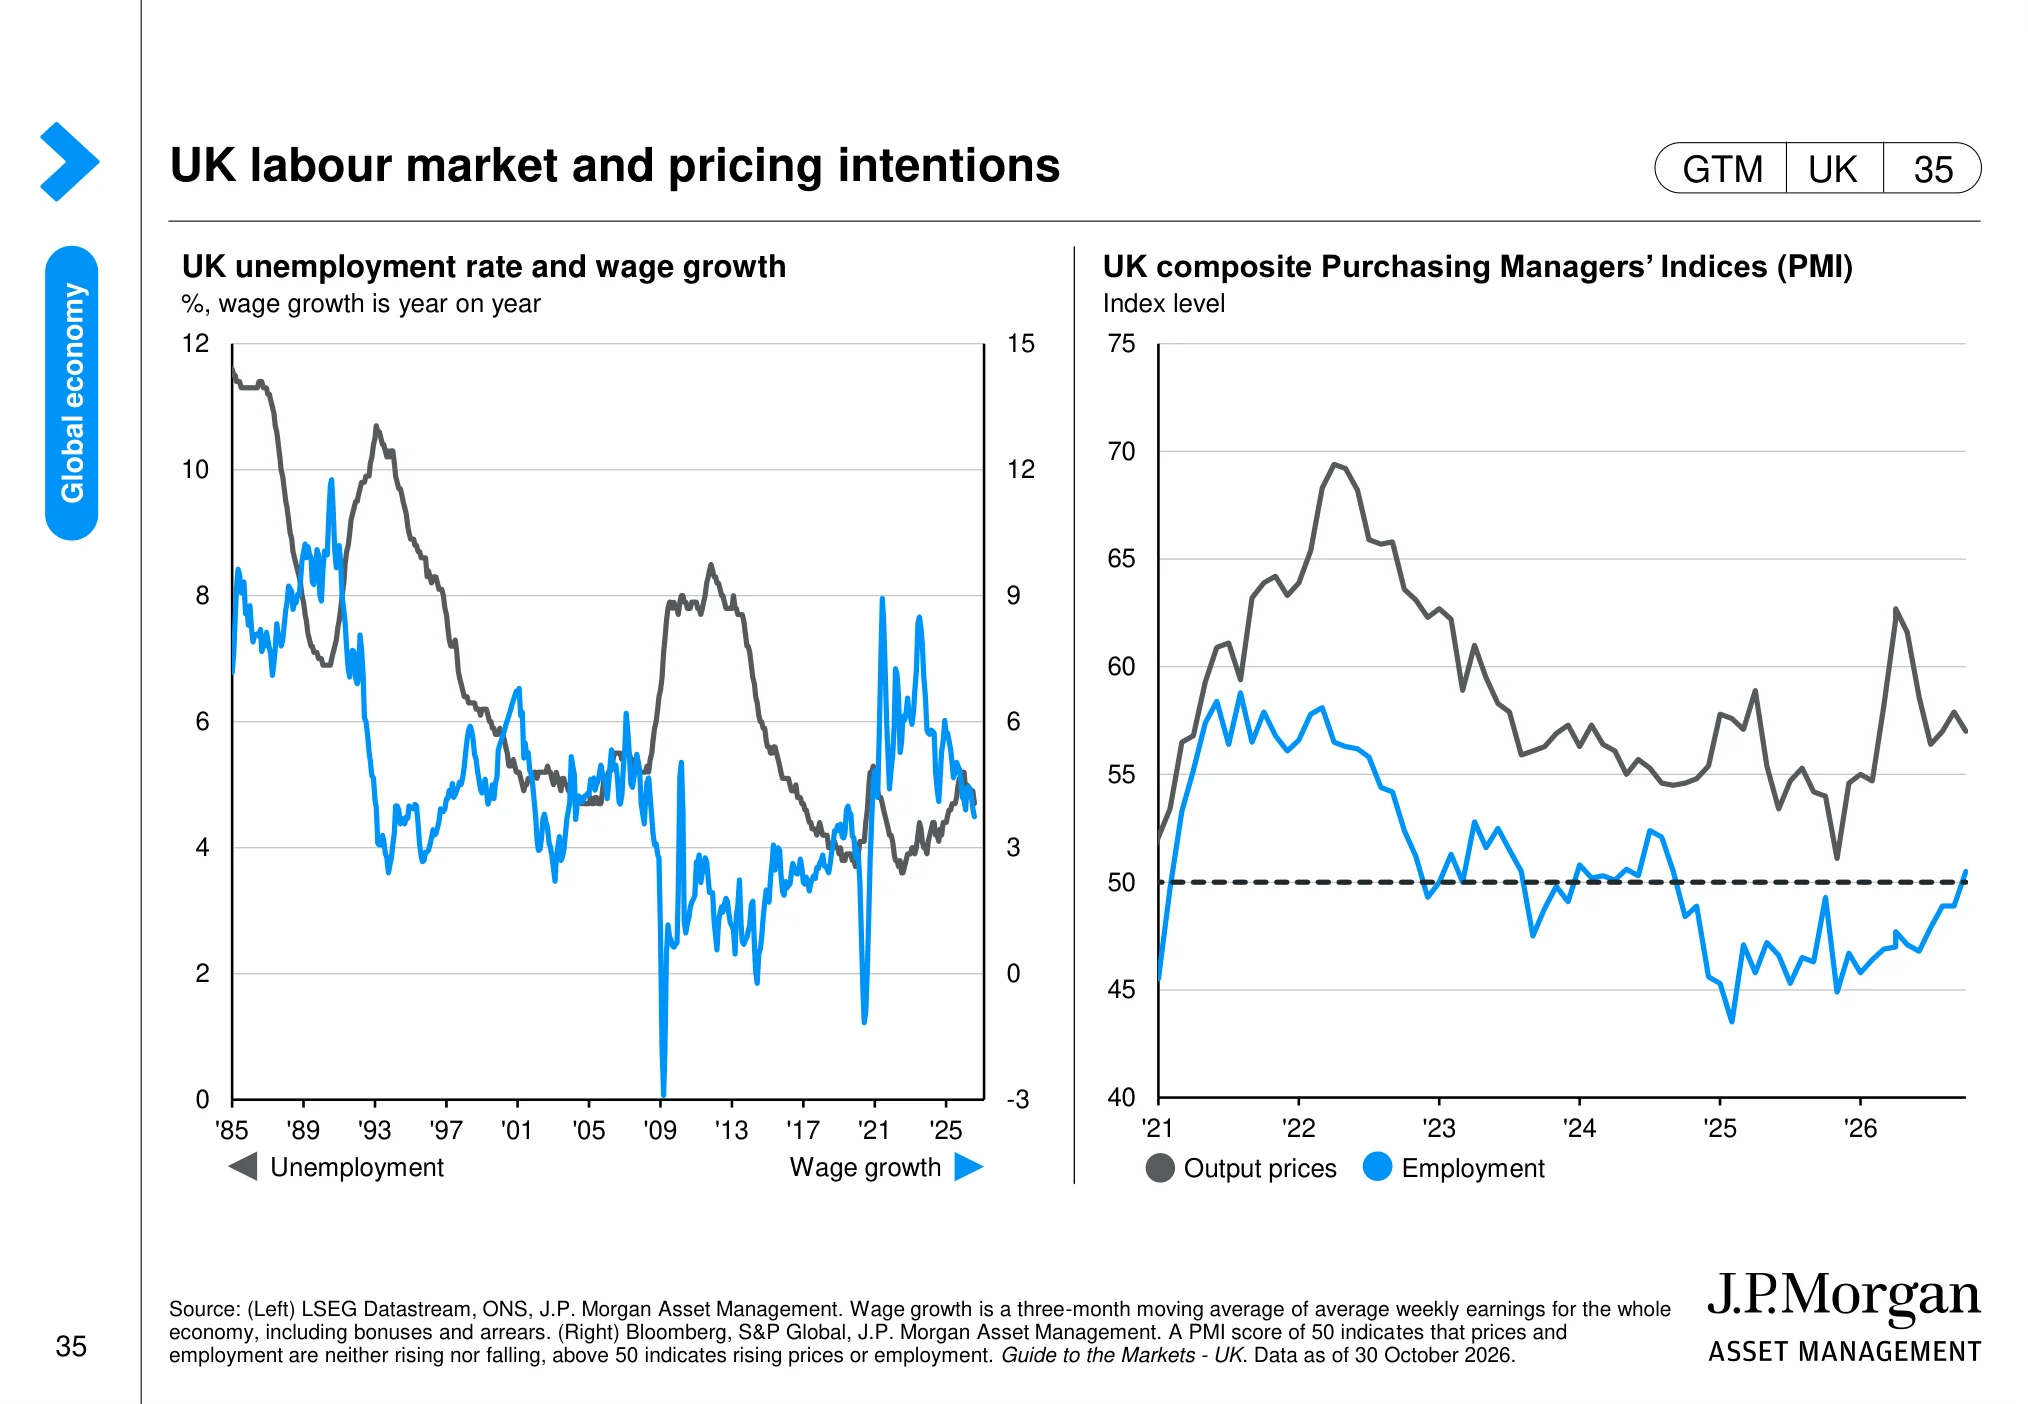
UK labour market and pricing intentions (page 35)
 (opens in a new tab)
The chart: The charts compare UK wage growth with business survey indicators for employment and pricing intentions. They provide a combined view of labour-market pressure and companies’ cost expectations.
Why it matters: Wage and pricing trends influence household purchasing power, company margins and the Bank of England’s policy decisions.
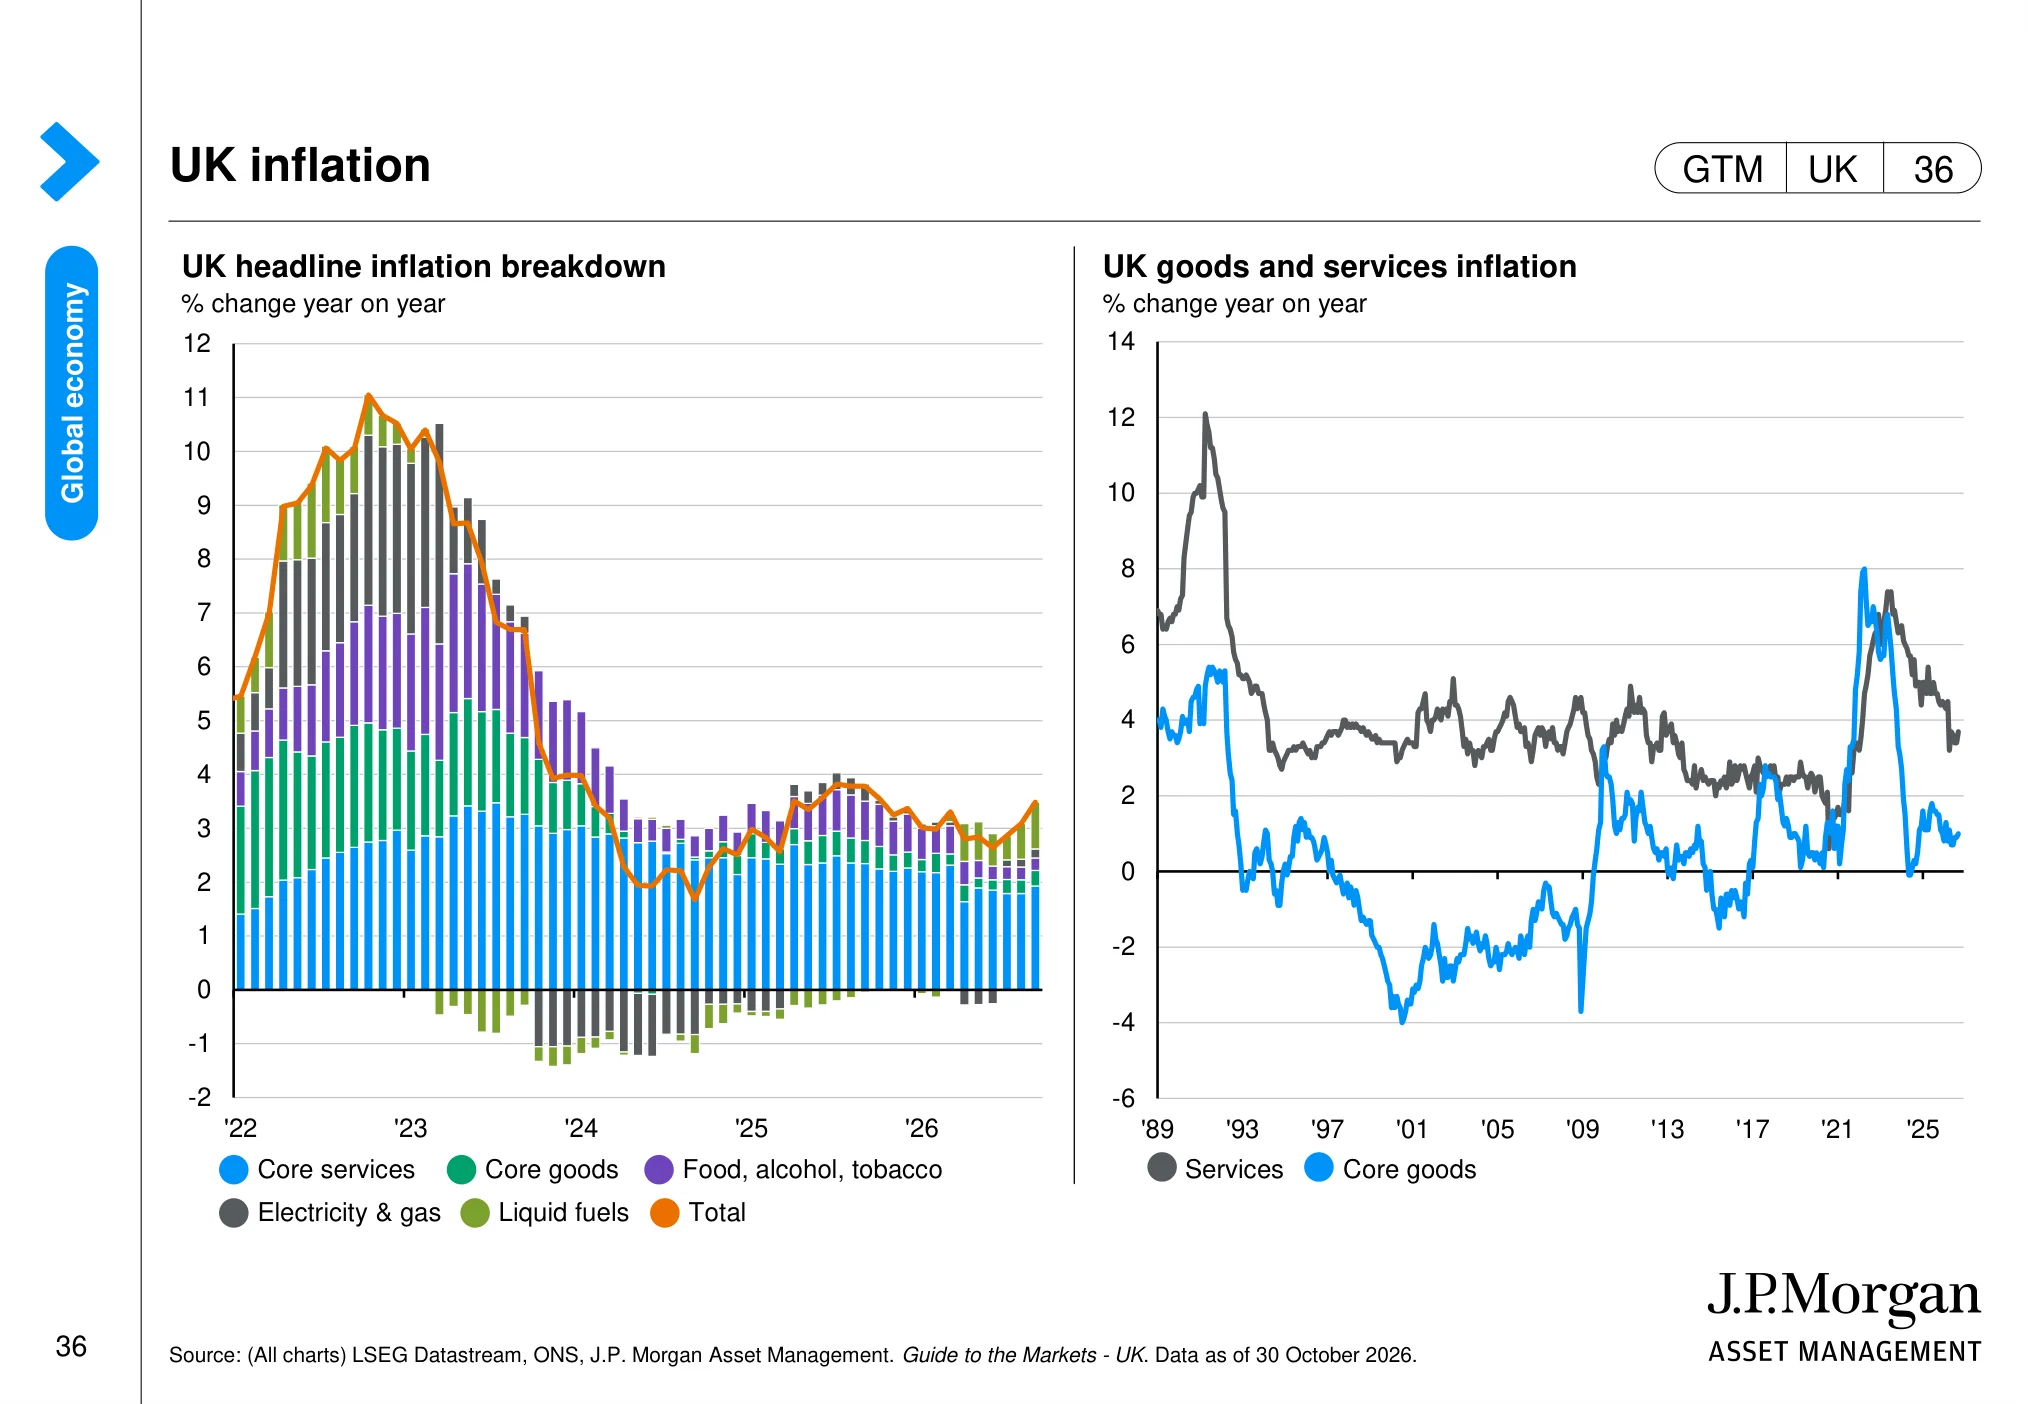
UK inflation (page 36)
 (opens in a new tab)
The chart: The page breaks UK headline inflation into components and compares goods and services inflation. This helps show which categories are contributing to changes in the overall inflation rate.
Why it matters: The composition of inflation matters for the outlook for real incomes, business costs and UK interest rates.
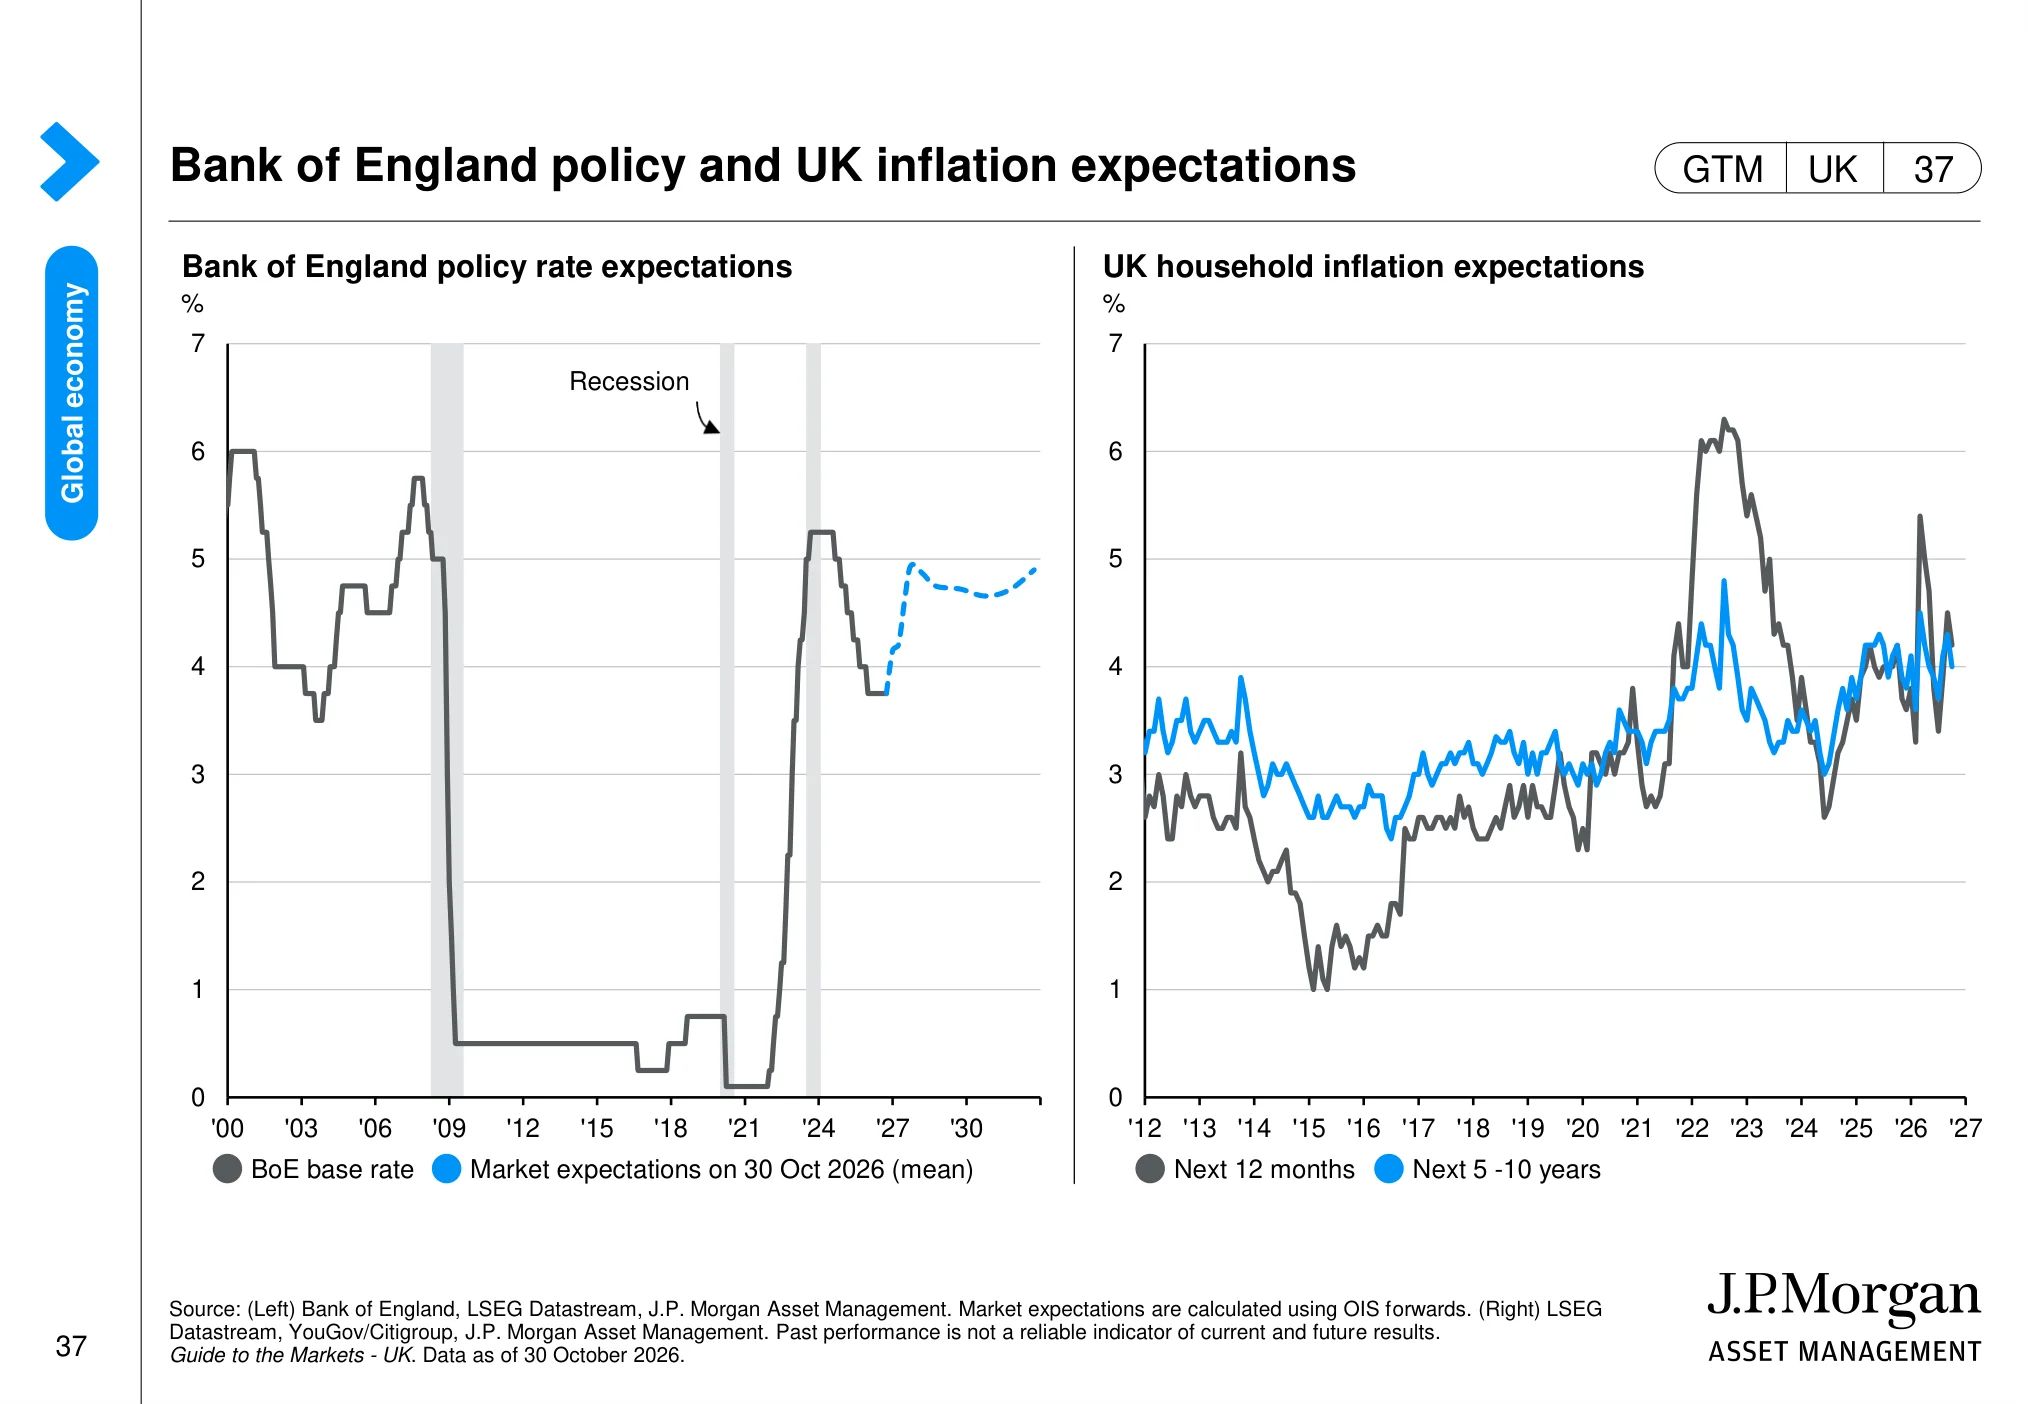
Bank of England policy and UK inflation expectations (page 37)
 (opens in a new tab)
The chart: The charts show Bank of England policy-rate expectations and measures of UK inflation expectations. Market pricing provides an indication of the rate path investors currently anticipate.
Why it matters: Changes in expected Bank Rate can affect sterling, borrowing costs and the valuation of UK equities.
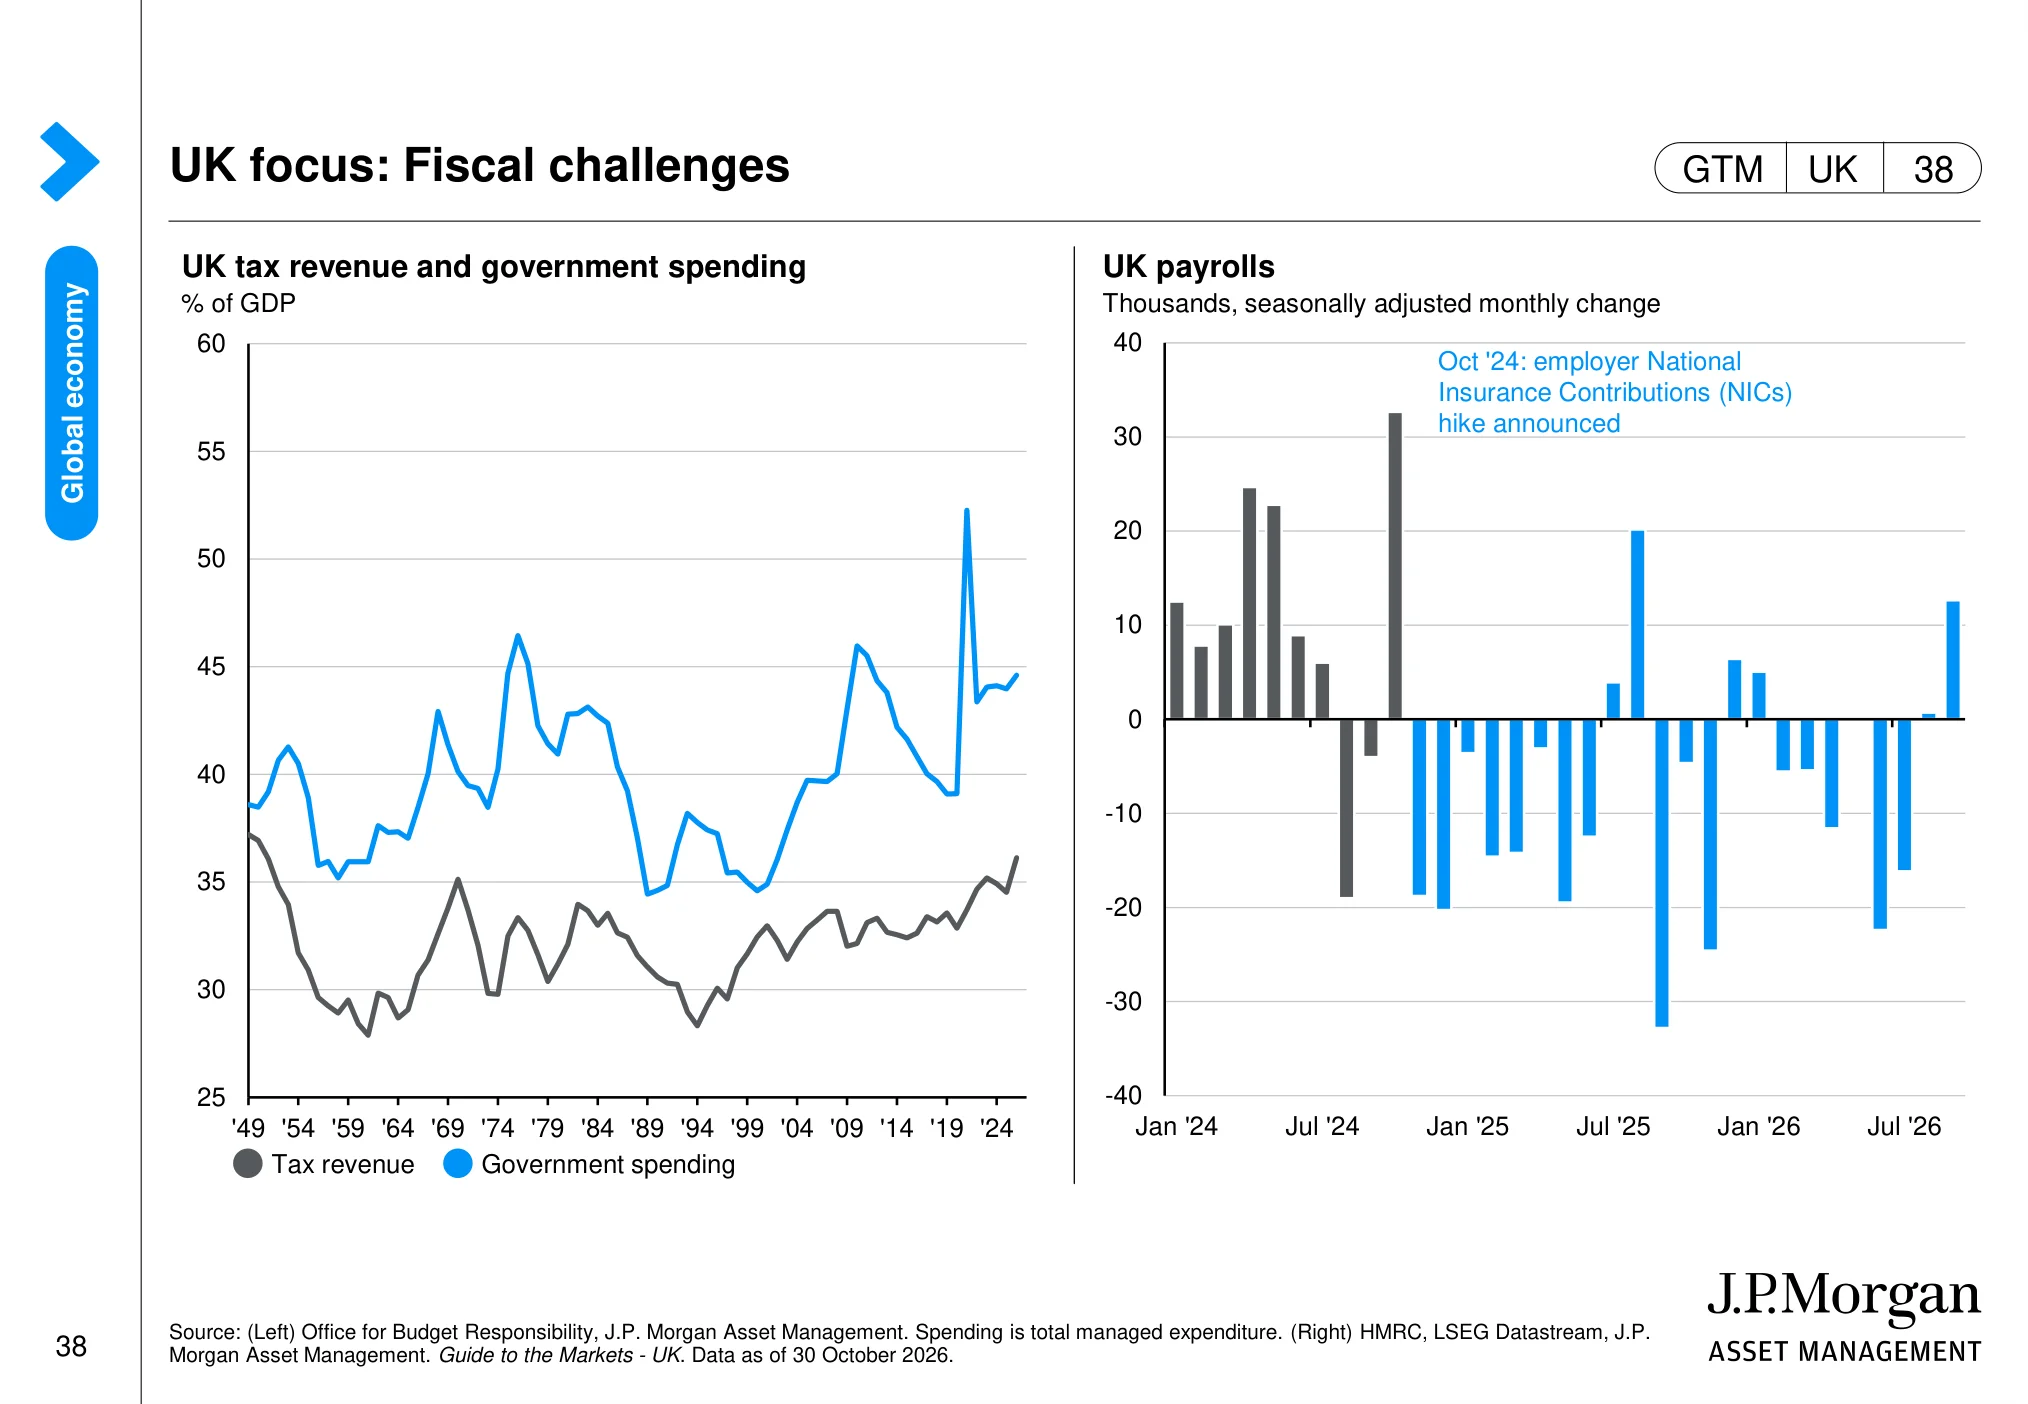
UK focus: Fiscal challenges (page 38)
 (opens in a new tab)
The chart: The page examines UK government tax revenue and spending, alongside changes in UK payrolls. It links the fiscal position with current labour-market conditions.
Why it matters: Fiscal pressures and employment trends can influence taxes, public spending, consumer demand and the outlook for UK-listed businesses.
Global equities: valuations, earnings and concentration
This is the heart of the guide for anyone investing in shares. Valuations tell you what you are paying. Earnings tell you what you are getting. Concentration tells you how many companies you really own when you buy an index.
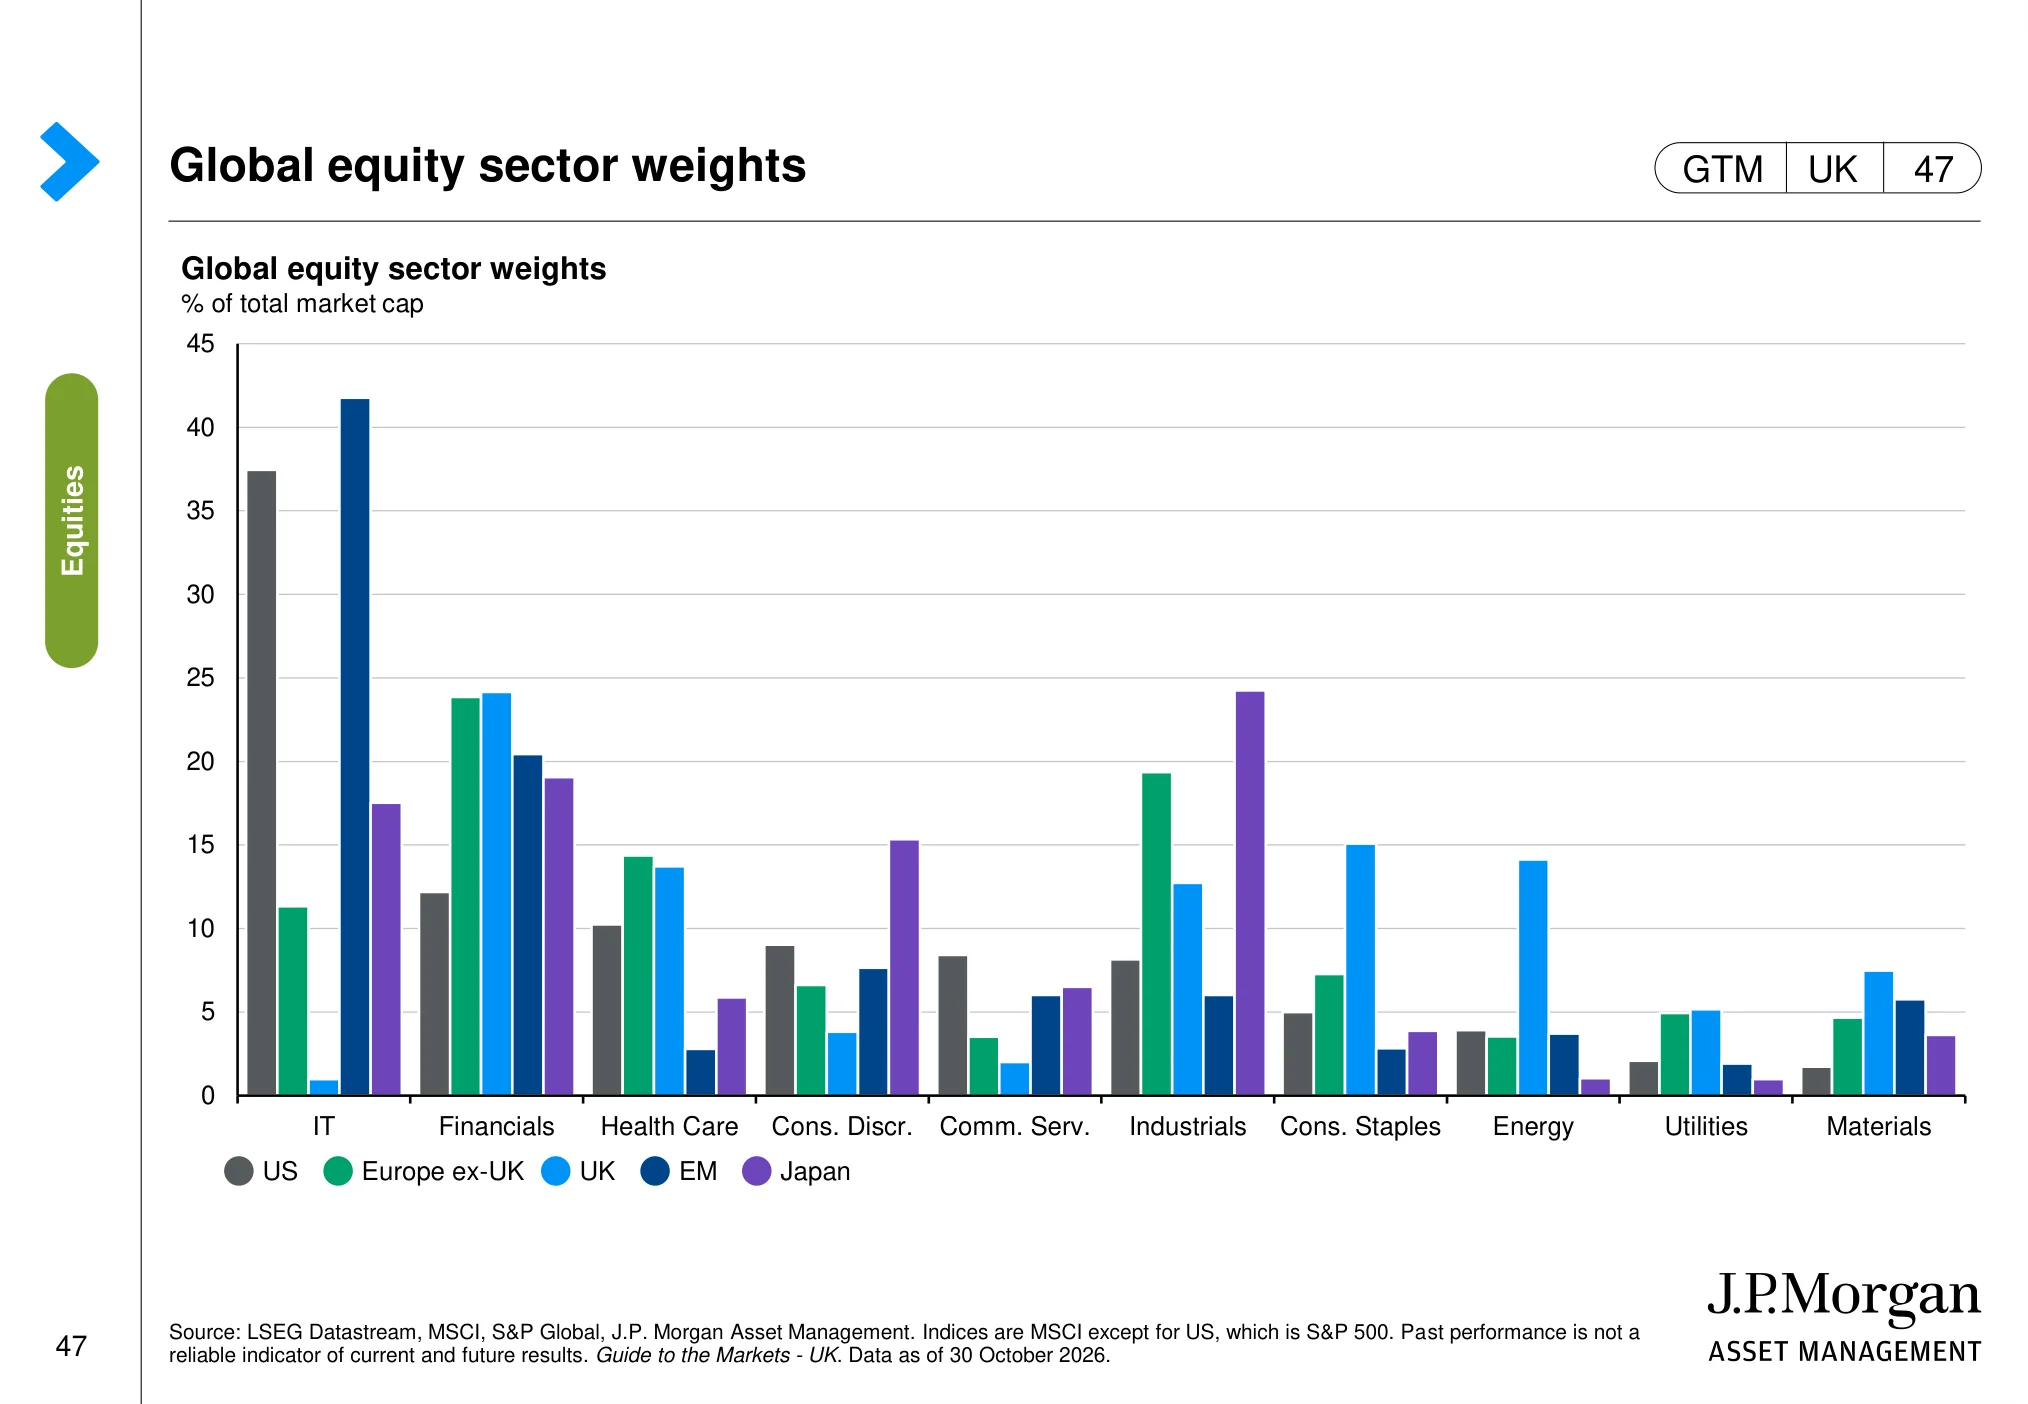
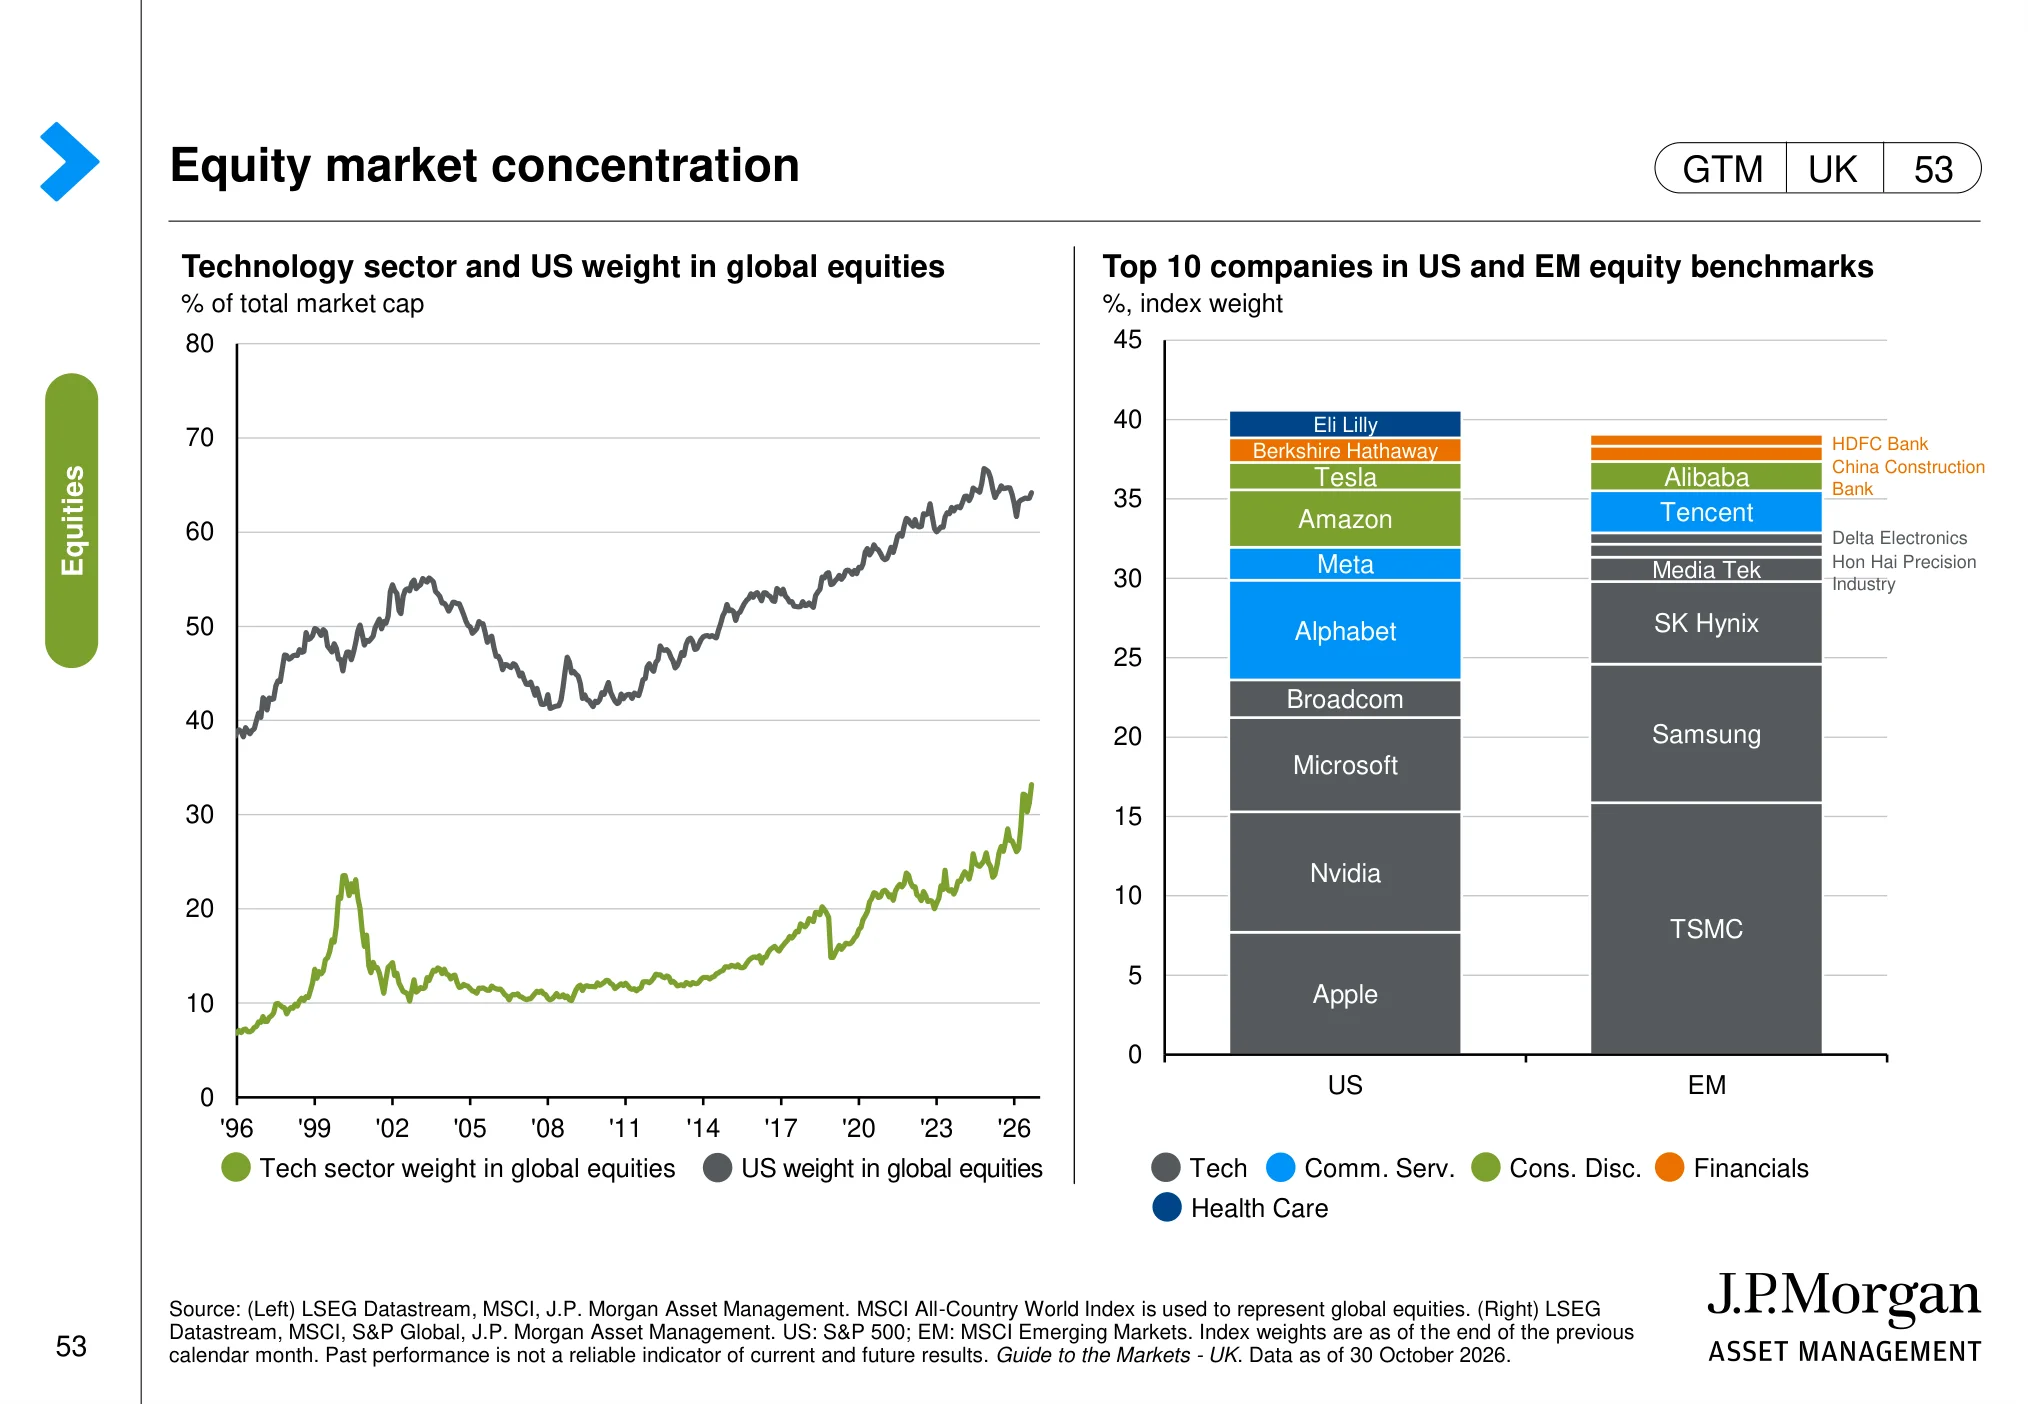
Three things from this section stand out. On J.P. Morgan's regional valuation chart, the US trades well above its median since 2000, while the UK, Japan and emerging markets trade below theirs. And the sector mix is radically different: information technology is about 37% of the S&P 500 but only about 1% of the UK market, where financials, consumer staples and energy dominate. Finally, on the concentration chart, the ten largest companies make up around 40% of the S&P 500, while technology is now roughly a third of the entire global stock market.
Regional equity valuations (page 44)
 (opens in a new tab)
The chart: The chart compares 12-month forward price-to-earnings valuations across major equity markets, including the US and UK, against their own historical ranges.
Why it matters: Relative valuation helps investors compare the price paid for expected earnings in US and UK shares, while accounting for each market’s history.
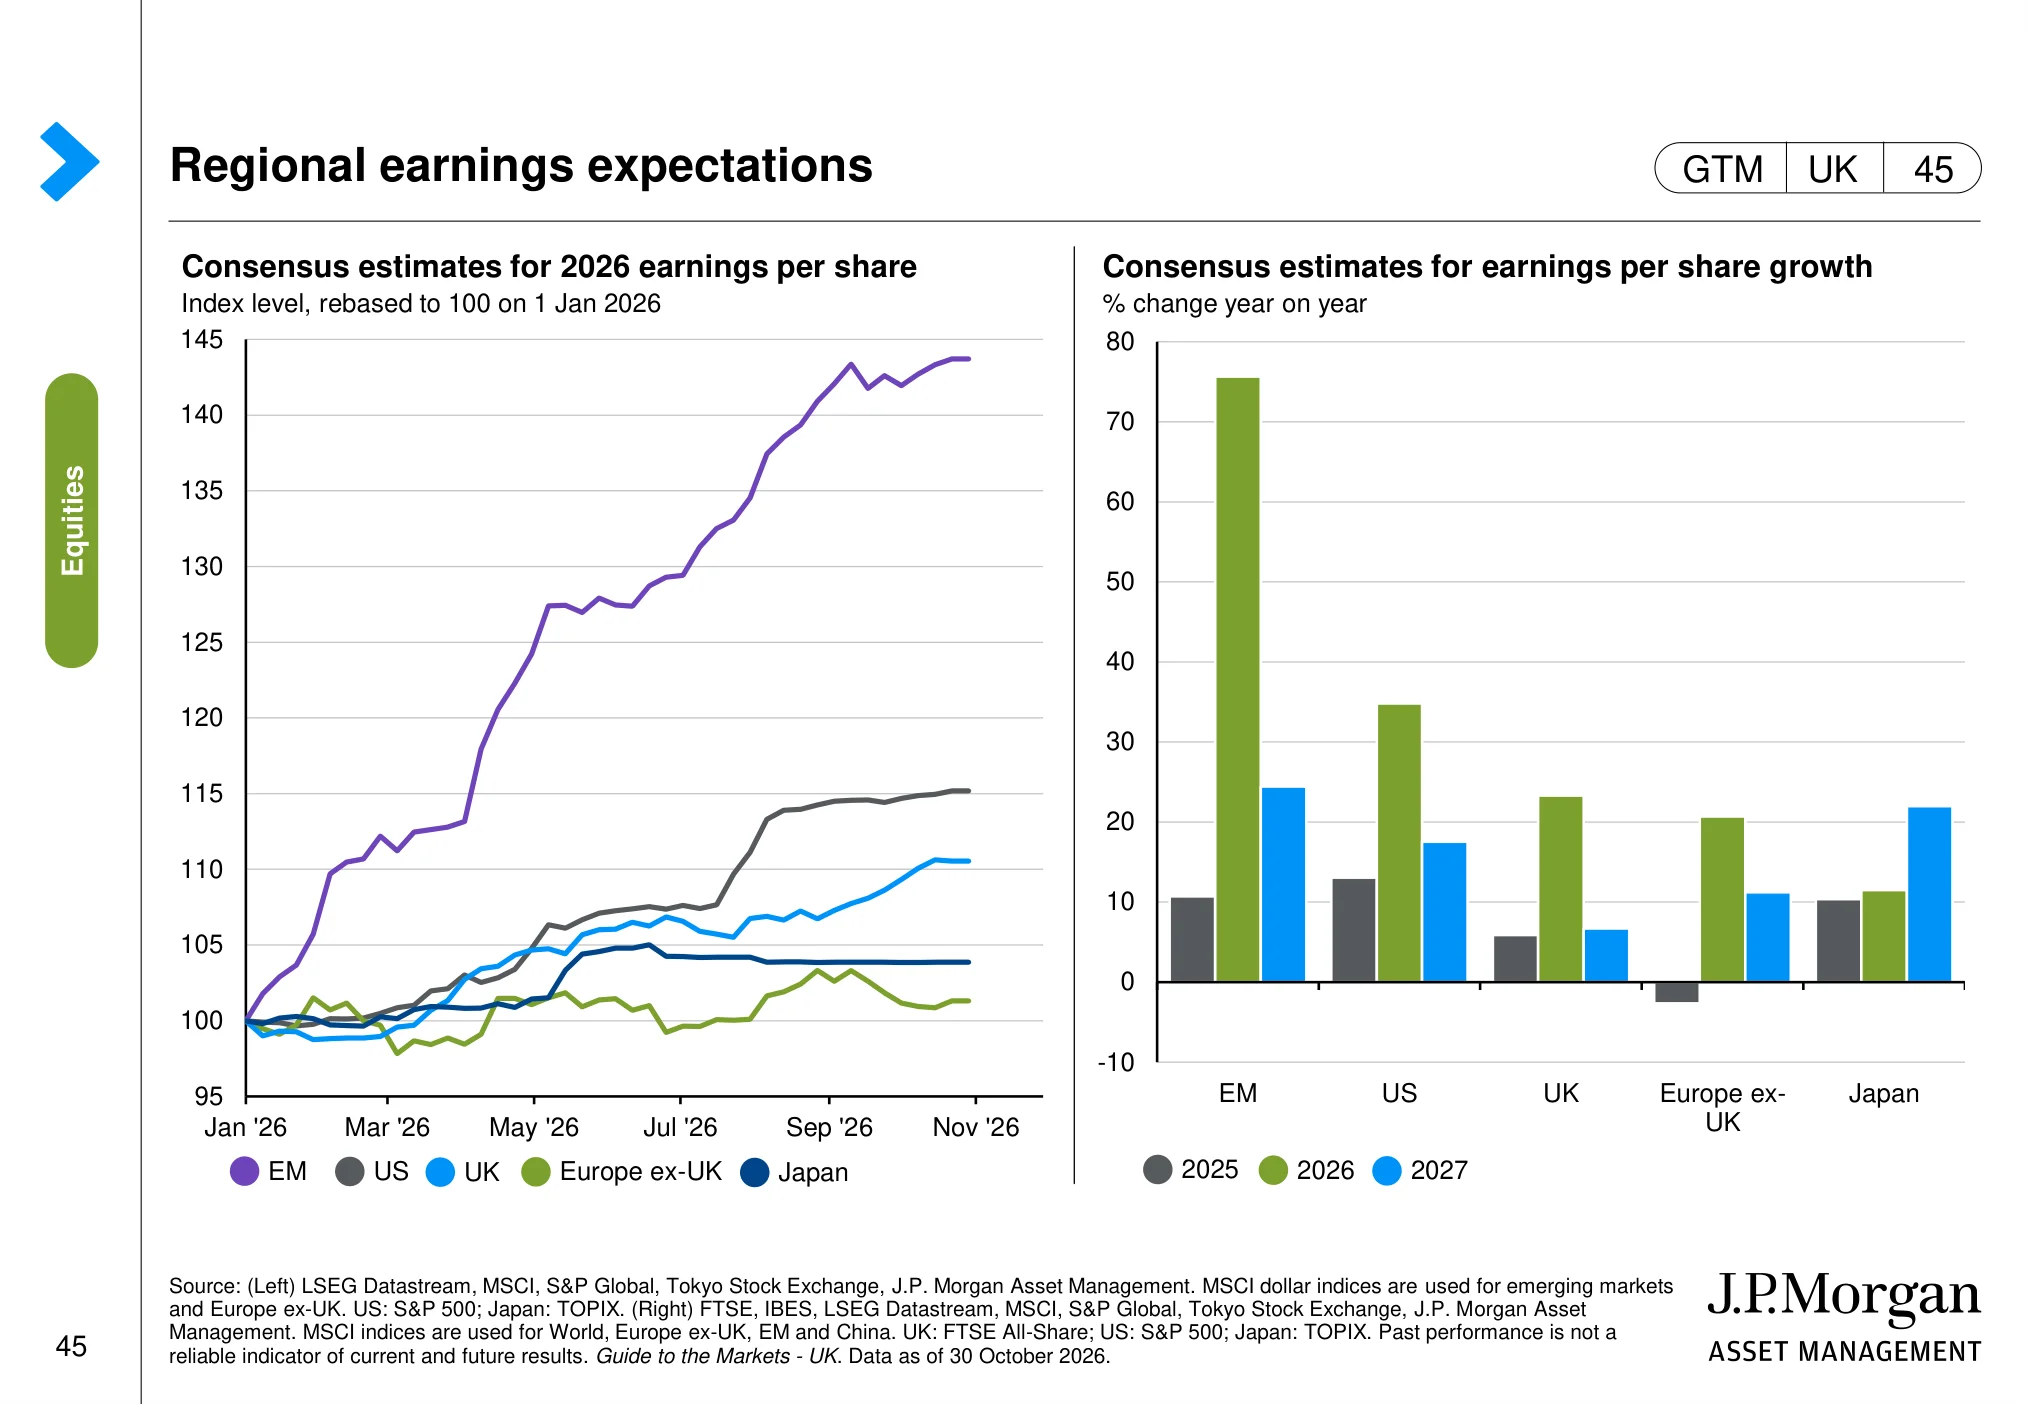
Regional earnings expectations (page 45)
 (opens in a new tab)
The chart: The page compares regional equity performance and earnings expectations, including the US and UK. It helps separate market-price movements from changes in analysts’ profit forecasts.
Why it matters: Sustainable share-price performance ultimately depends on earnings delivery, not valuation changes alone.
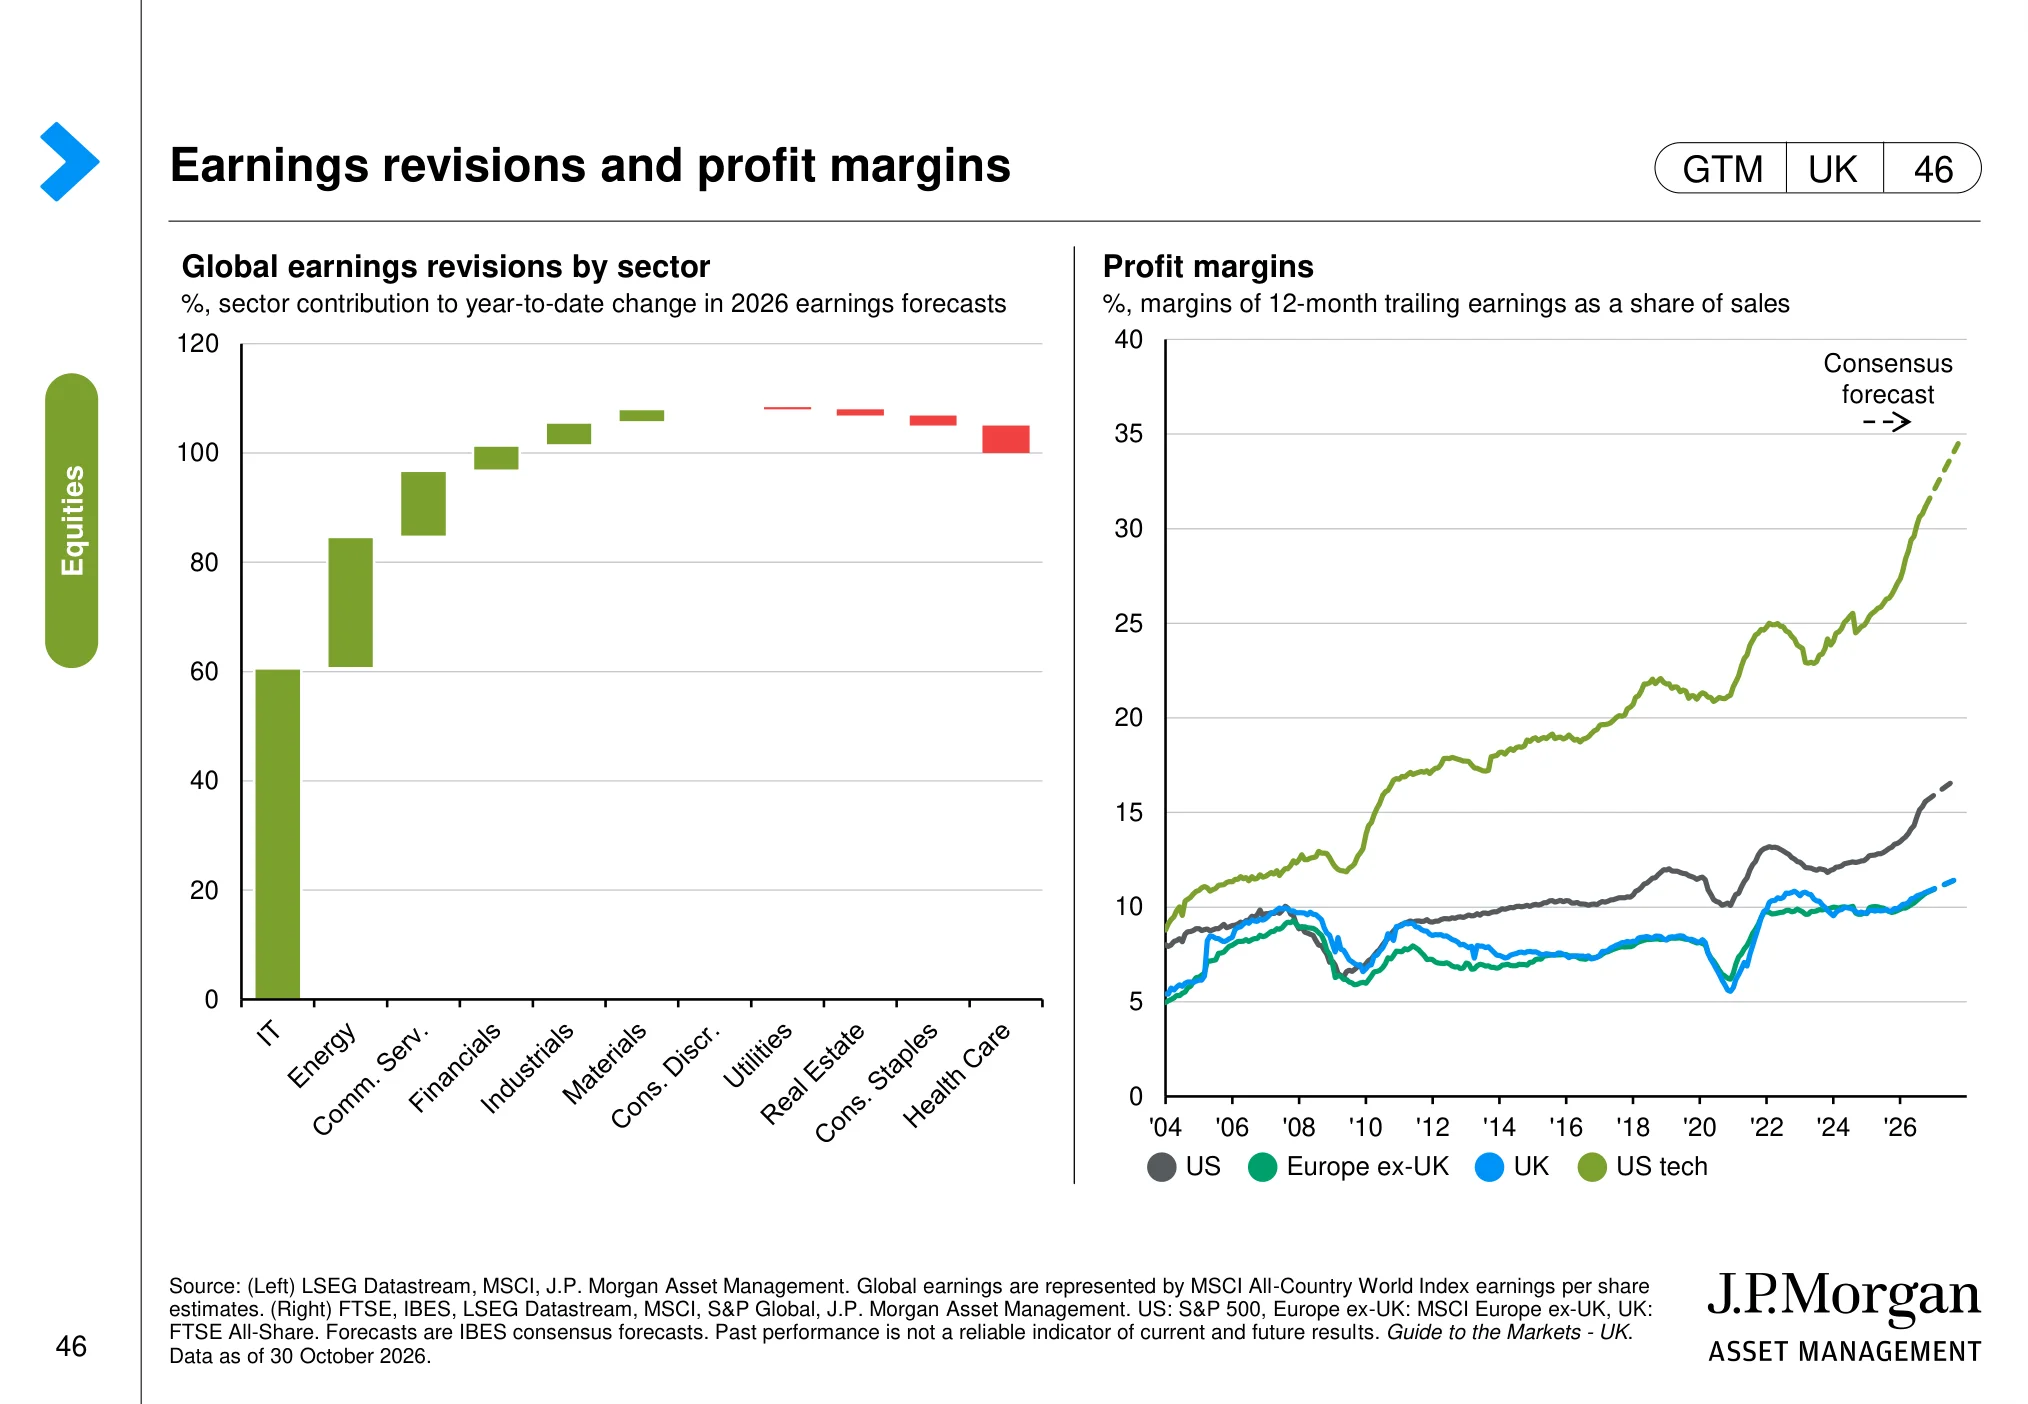
Earnings revisions and profit margins (page 46)
 (opens in a new tab)
The chart: The charts track global earnings revisions and compare profit margins across major equity markets, including the US and UK.
Why it matters: Earnings revisions and margins help identify where analysts are becoming more or less confident about companies’ profitability.
Global equity sector weights (page 47)
 (opens in a new tab)
The chart: The chart compares the sector weights of major equity markets, including the US and UK. It highlights differences in exposure to technology, financials, healthcare, energy and other industries.
Why it matters: Market-level returns can reflect sector composition as much as stock selection, so the UK and US indices offer different sector exposures.
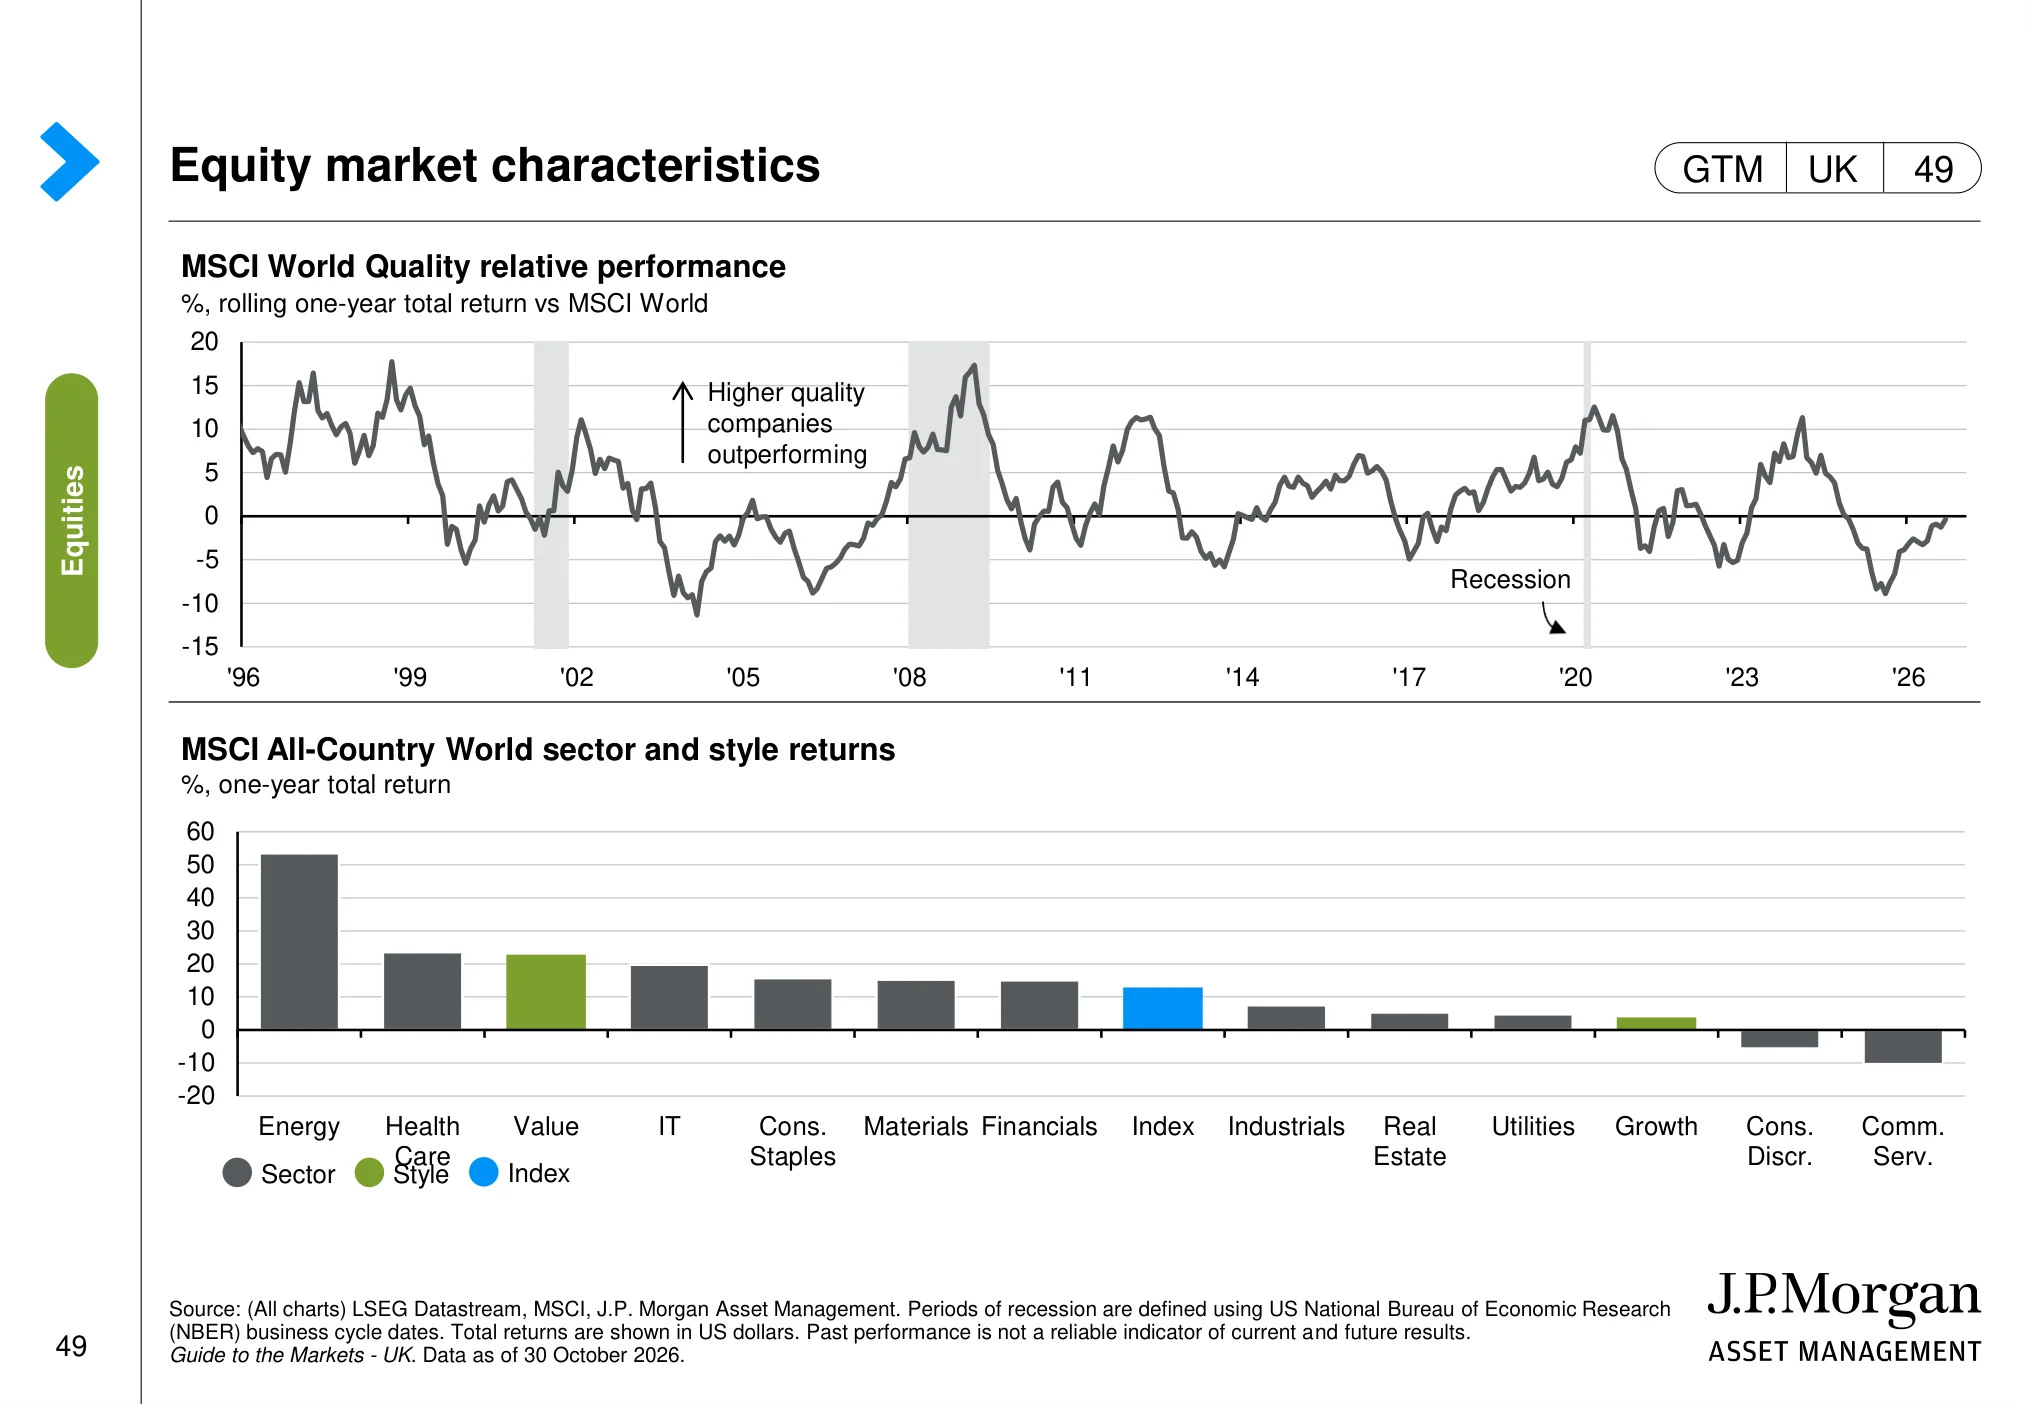
Equity market characteristics (page 49)
 (opens in a new tab)
The chart: The page compares equity-market characteristics over time, including the relative performance of investment styles and market segments shown in the original charts.
Why it matters: Style and market-characteristic cycles can affect which types of companies lead or lag, even when the wider market is rising.
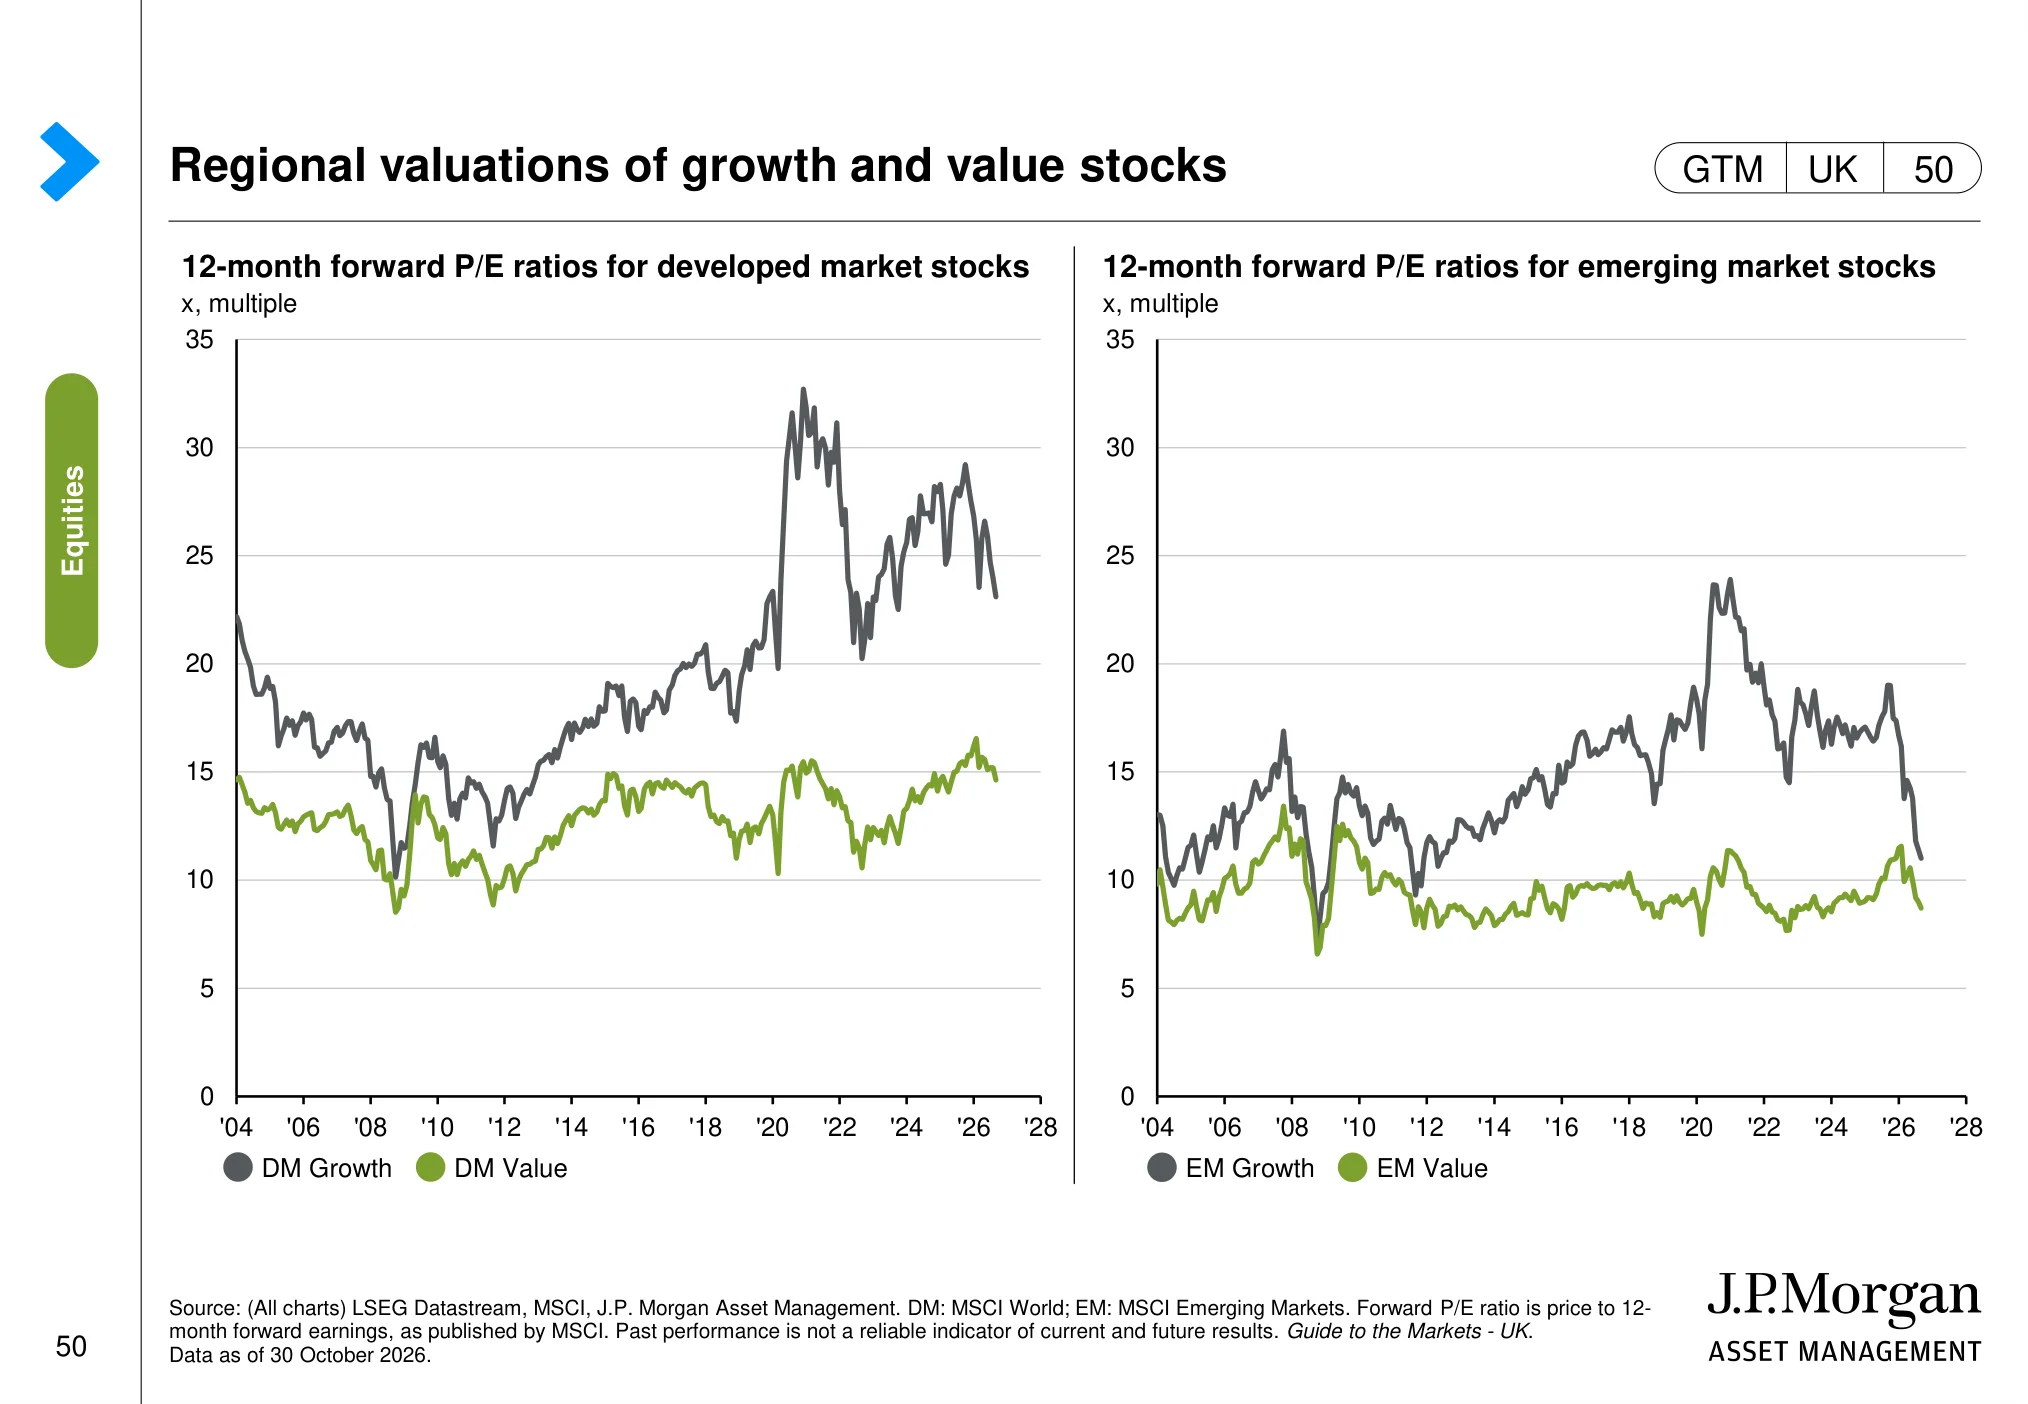
Regional valuations of growth and value stocks (page 50)
 (opens in a new tab)
The chart: The charts compare forward valuations for growth and value shares across developed and emerging markets over time.
Why it matters: Growth and value valuations help investors understand how much optimism is already reflected in different types of shares.
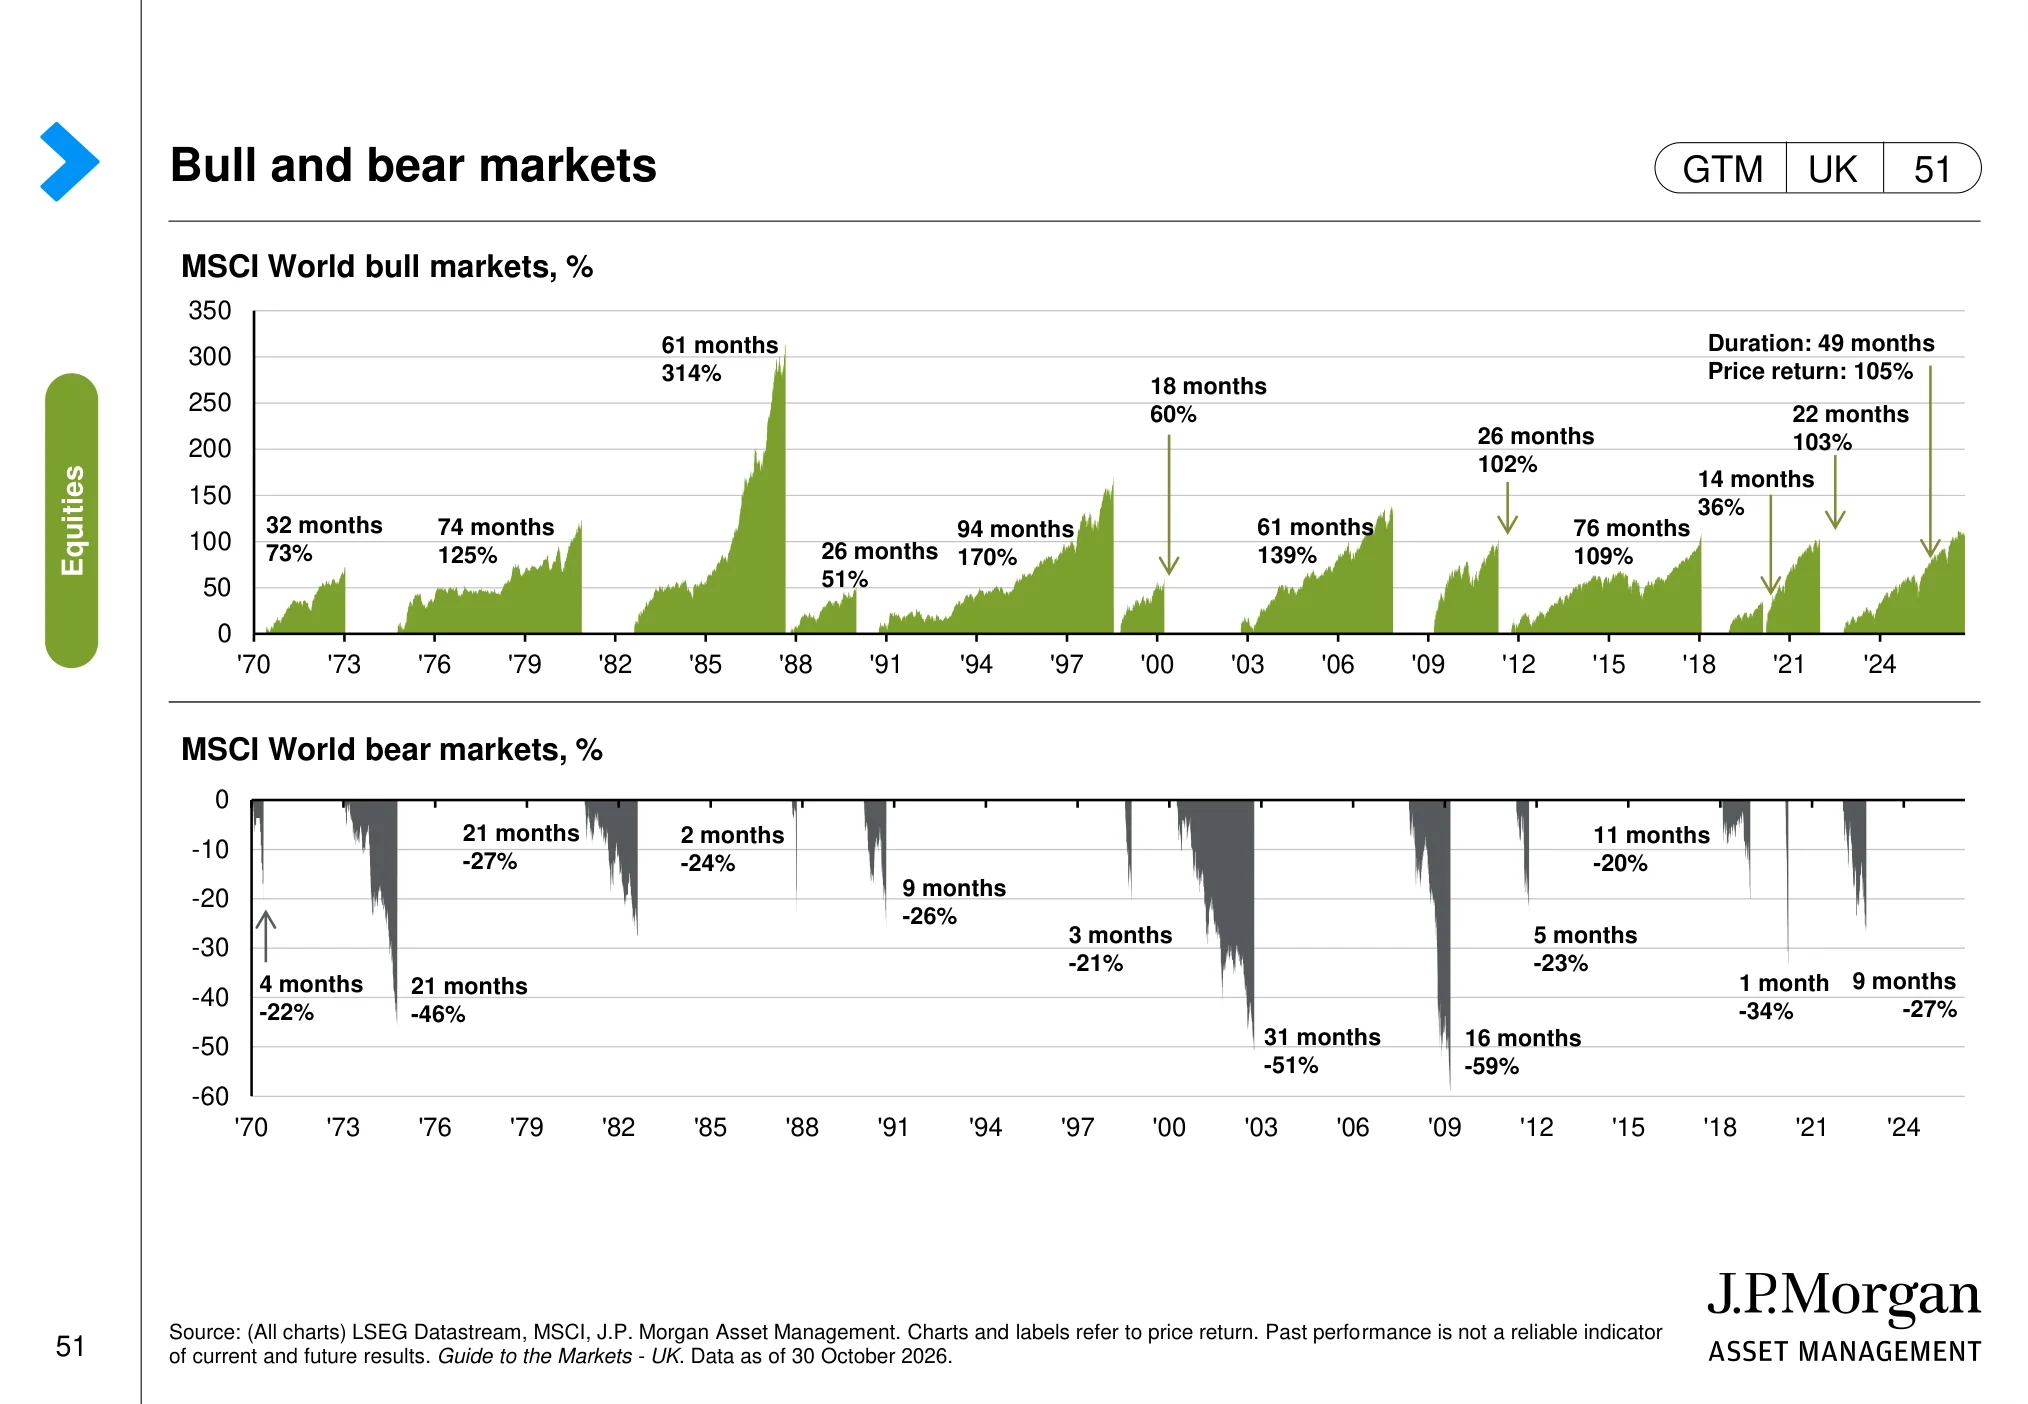
Bull and bear markets (page 51)
 (opens in a new tab)
The chart: The charts show the history of bull and bear markets, including the scale and duration of market advances and declines.
Why it matters: Market falls are a normal feature of investing; understanding their history can help investors avoid reacting to short-term volatility.
Small caps (page 52)
 (opens in a new tab)
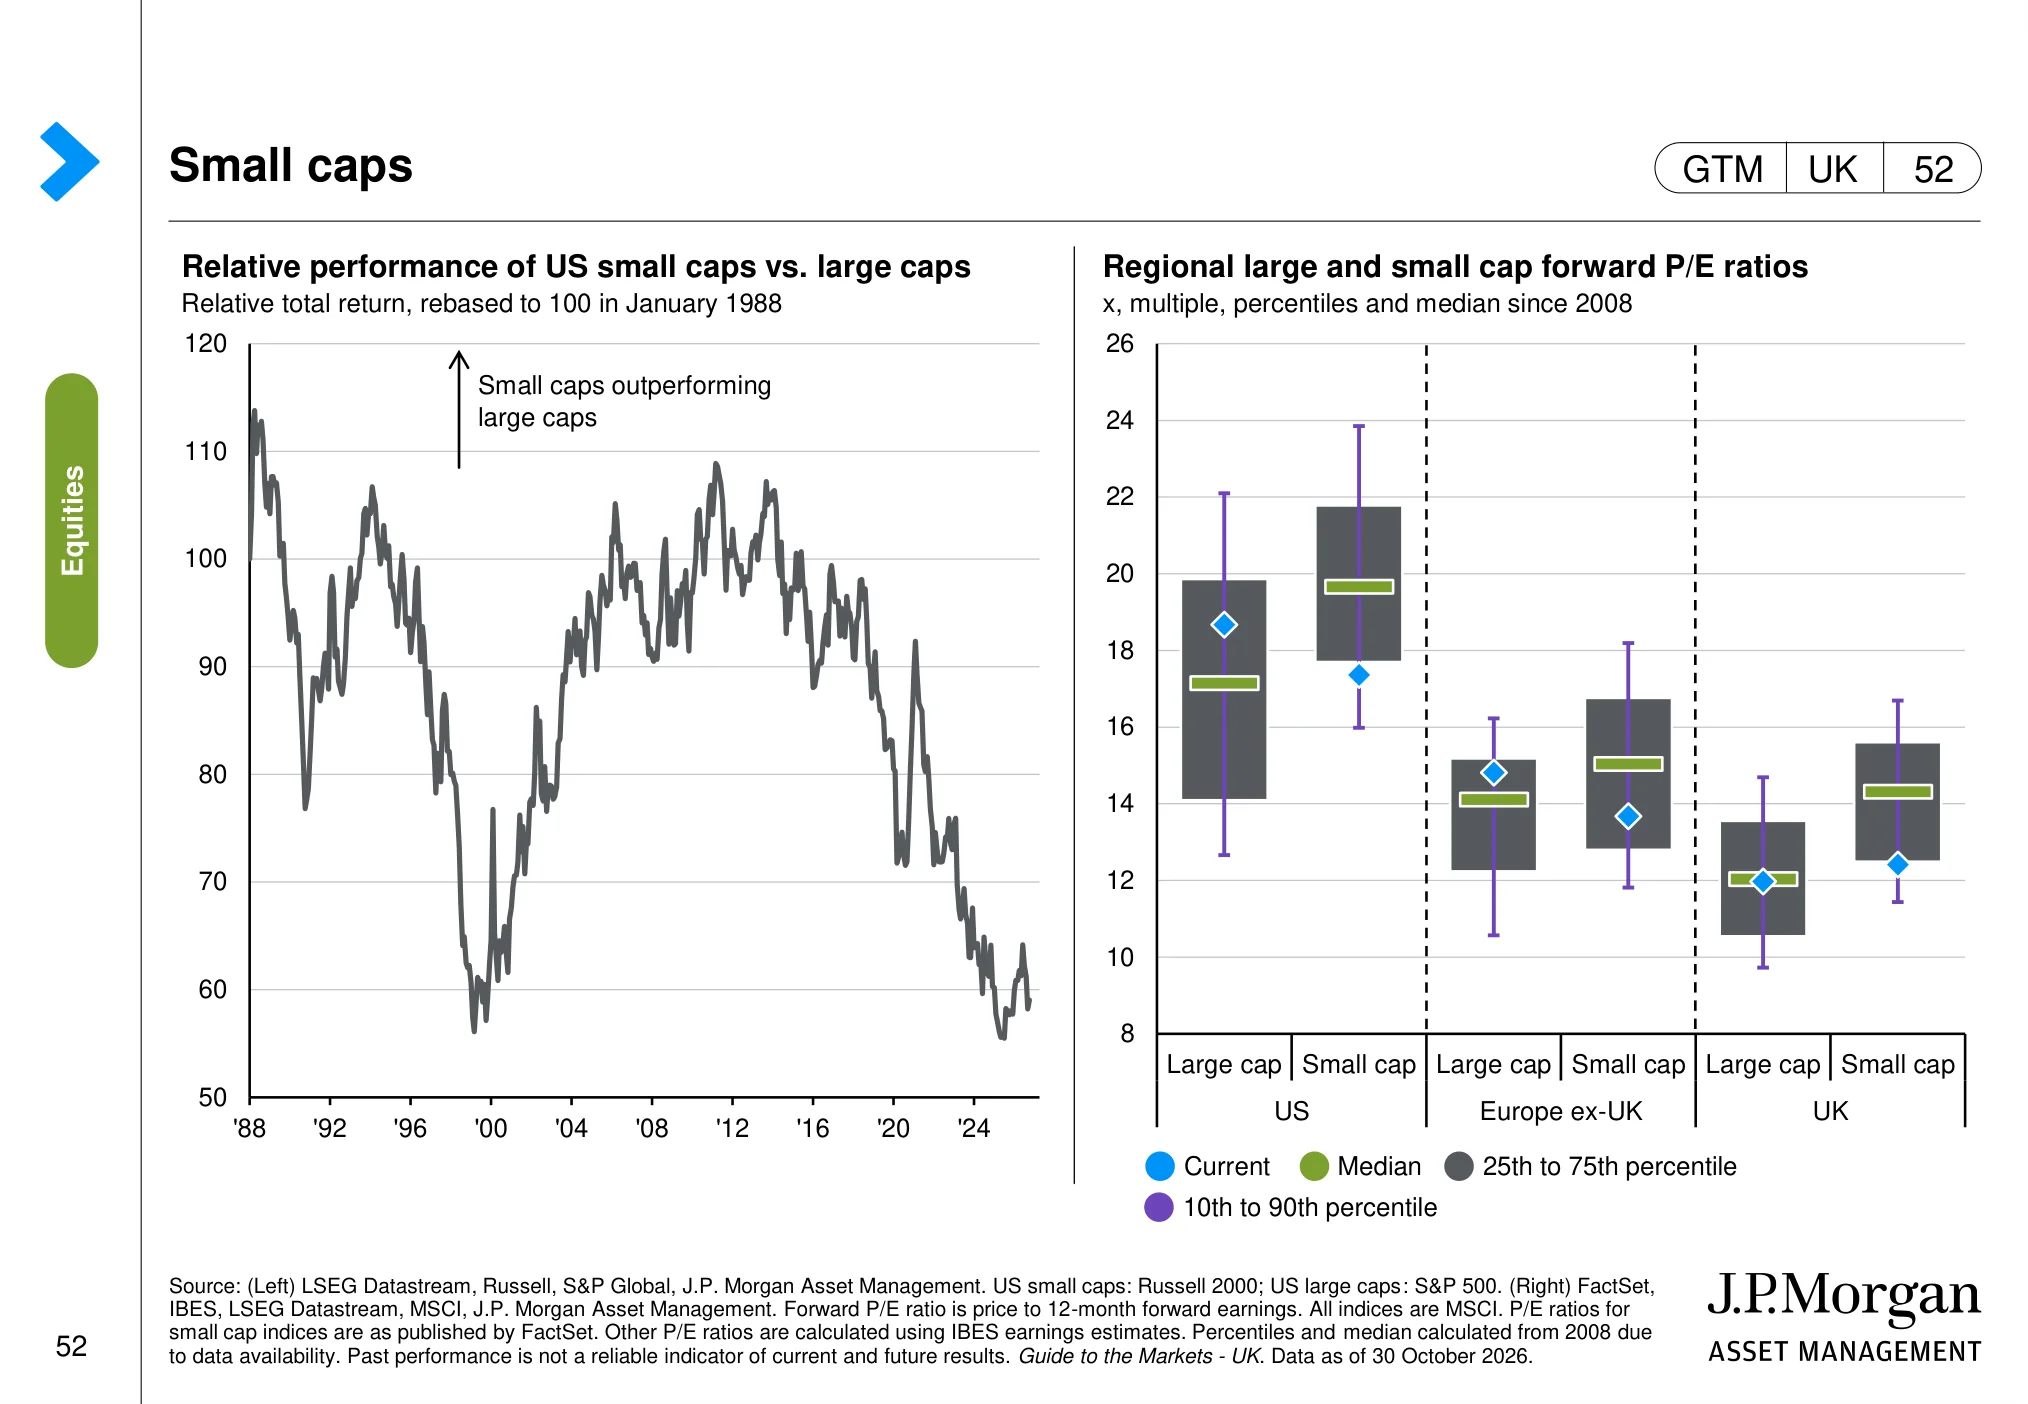
The chart: The page compares large-and small-cap performance and valuations in the US, UK and other regions. It highlights how smaller companies can move differently from larger businesses.
Why it matters: Small caps can offer different growth and valuation opportunities, but their performance may be more sensitive to financing costs and economic conditions.
Equity market concentration (page 53)
 (opens in a new tab)
The chart: The charts show the weight of the largest companies in global and US equity indices and how market concentration has changed over time.
Why it matters: A concentrated index can be heavily influenced by a relatively small number of large companies, which matters for diversification and portfolio risk.
US equities: earnings, valuations and future returns
US shares have led the world for more than a decade, so the question every investor asks is whether they are now too expensive. J.P. Morgan's slides do not answer that with a forecast. They show you the evidence and leave you to weigh it.
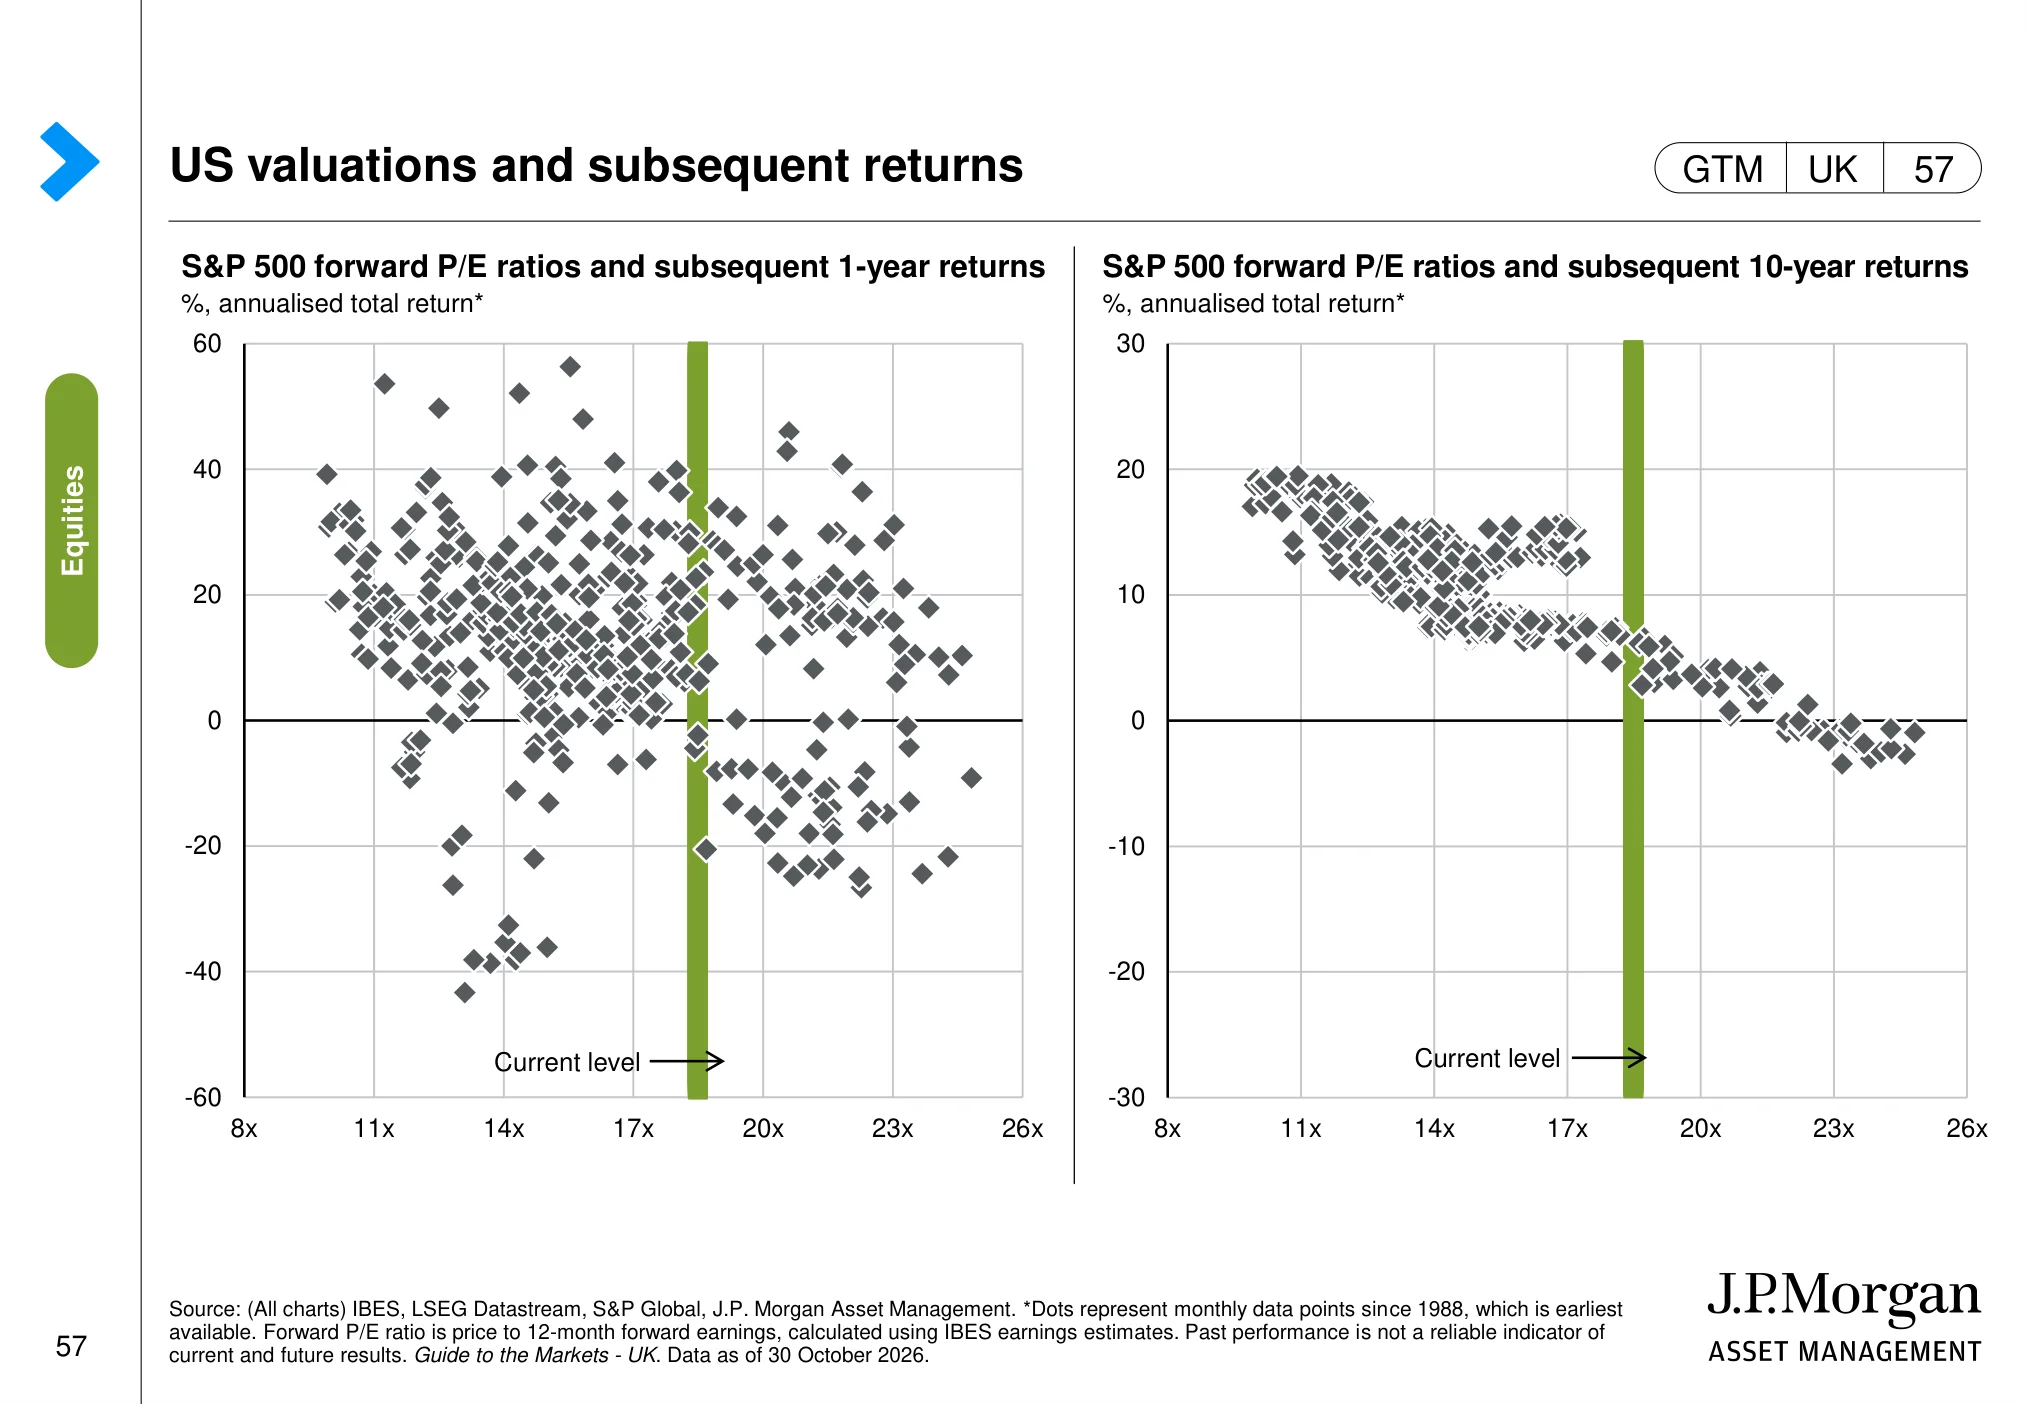
The S&P 500's forward P/E of 18.5x on 30 October 2026 compares with a 16.7x average since 1990. On a longer lens, the Shiller CAPE ratio stands at 40.7x against an average of 27.3x since 1990, and the price-to-book ratio is 5.4x against 3.2x. The scatter charts that follow are the honest bit: starting valuation tells you very little about the next twelve months, and a lot more about the next ten years.
US earnings (page 55)
 (opens in a new tab)
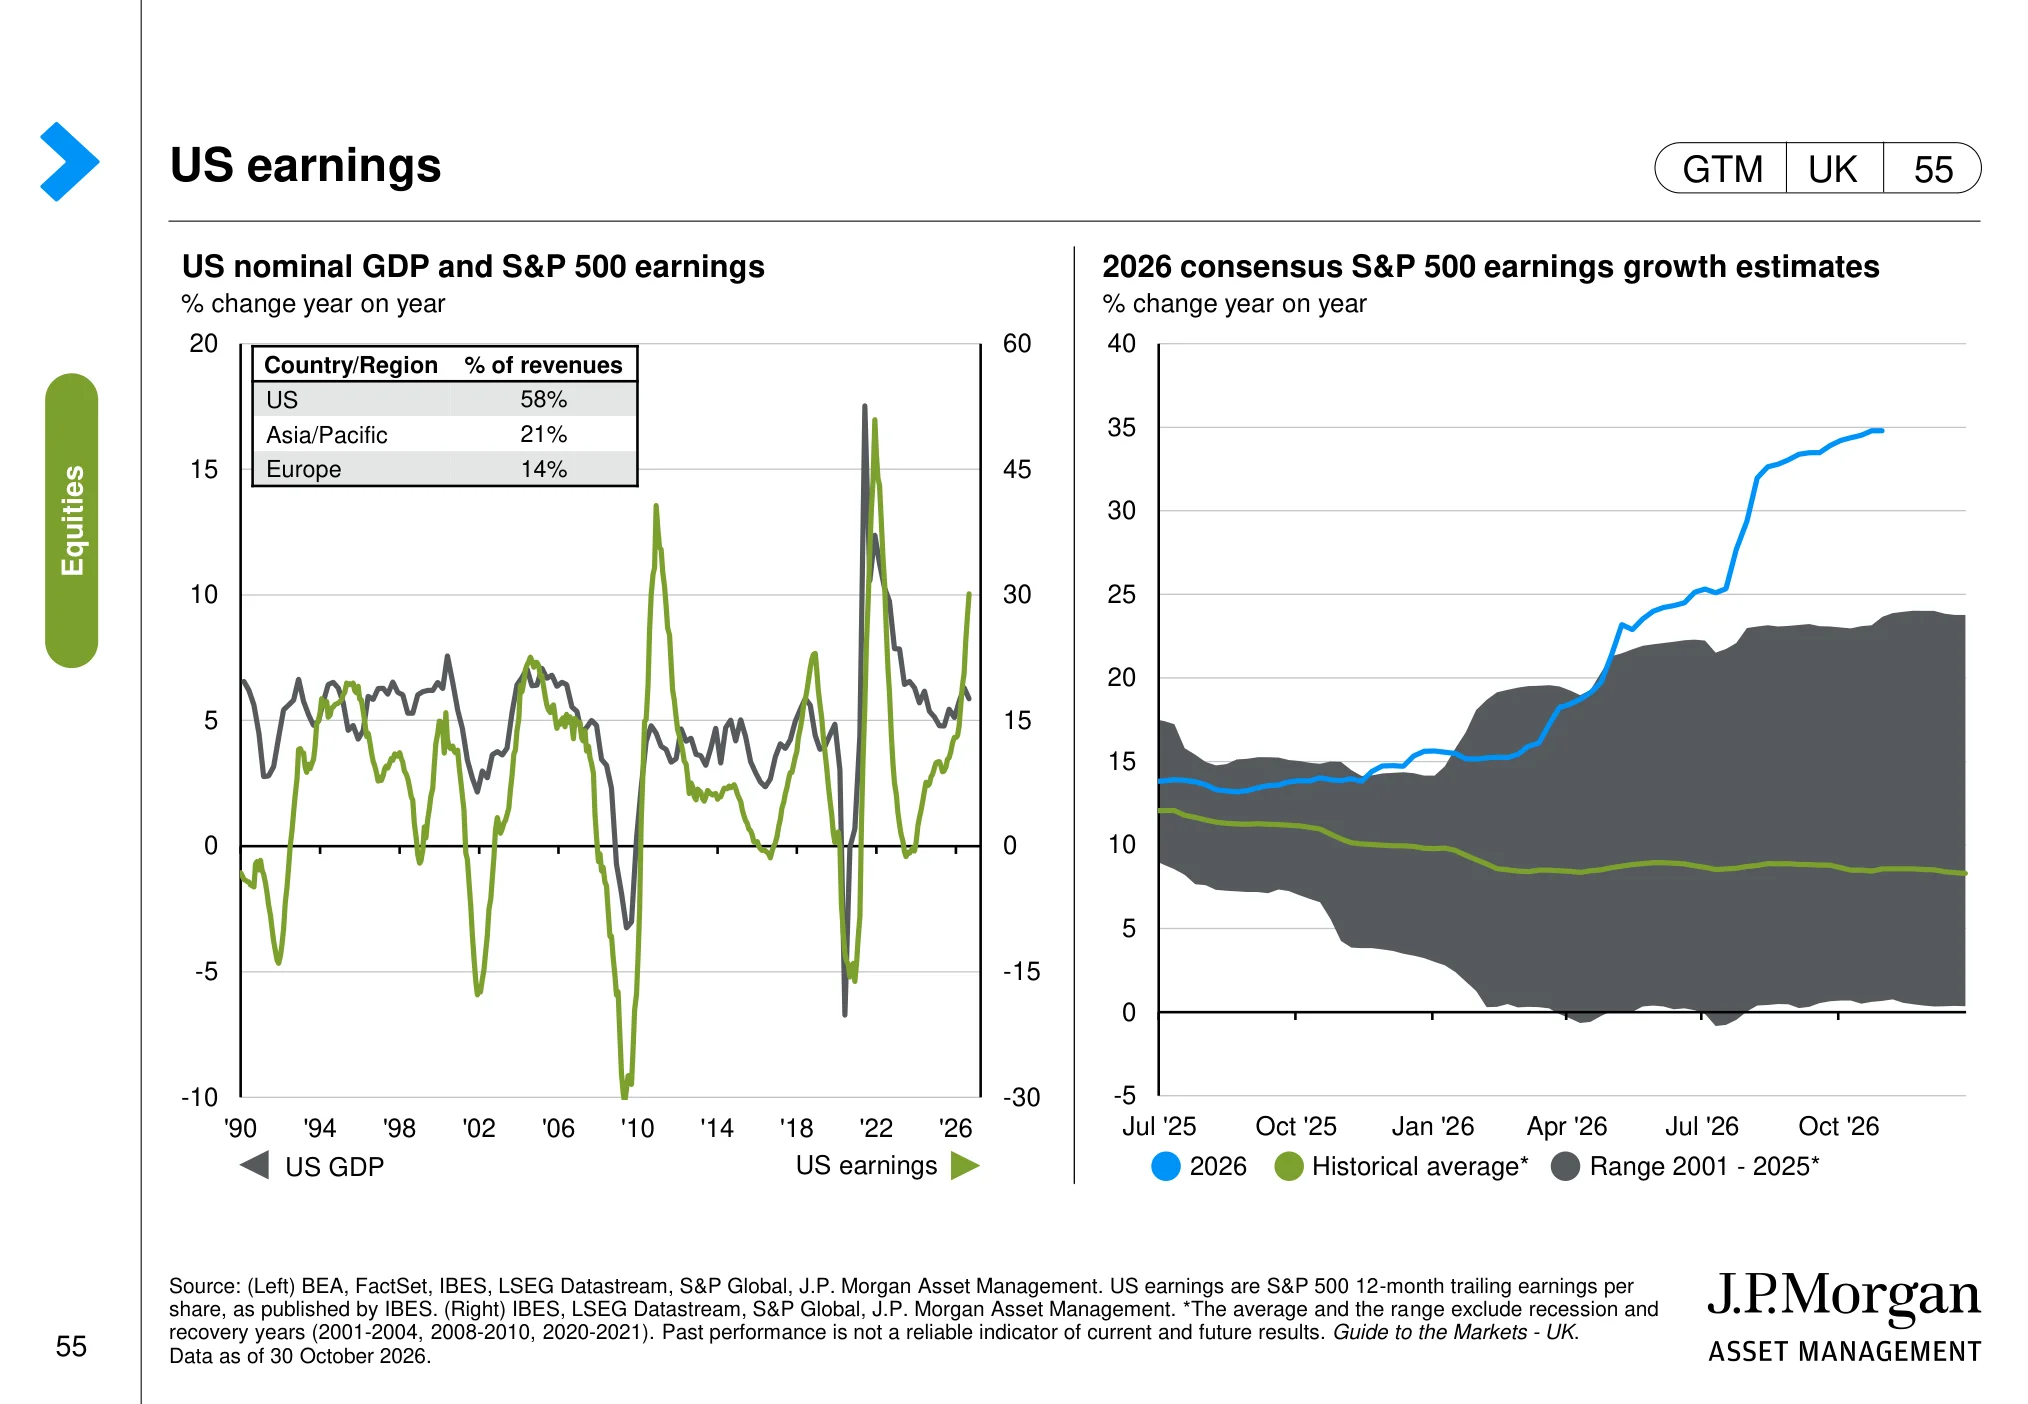
The chart: The charts show US earnings growth and compare current earnings trends with the historical range and average outside recession and recovery periods.
Why it matters: Earnings growth is a central driver of equity returns; investors should assess whether current expectations are supported by company profits.
US equity valuations (page 56)
 (opens in a new tab)
The chart: The page presents US equity valuation measures, including forward price-to-earnings and longer-term valuation comparisons.
Why it matters: Valuation does not time markets, but it helps frame expected returns and the risk of paying too much for future earnings.
US valuations and subsequent returns (page 57)
 (opens in a new tab)
The chart: The charts relate starting US forward valuations to subsequent market returns over different horizons. Historical observations show how outcomes have varied at different starting multiples.
Why it matters: Starting valuation can influence long-term return potential, although it cannot reliably predict short-term market direction.
UK and world equities: where the UK stands
Over the past fifteen years, many UK investors have learned the hard way that the home market can lag for long periods. The next three slides put UK shares in a global context and ask whether the discount reflects weaker profits or simply lower expectations.
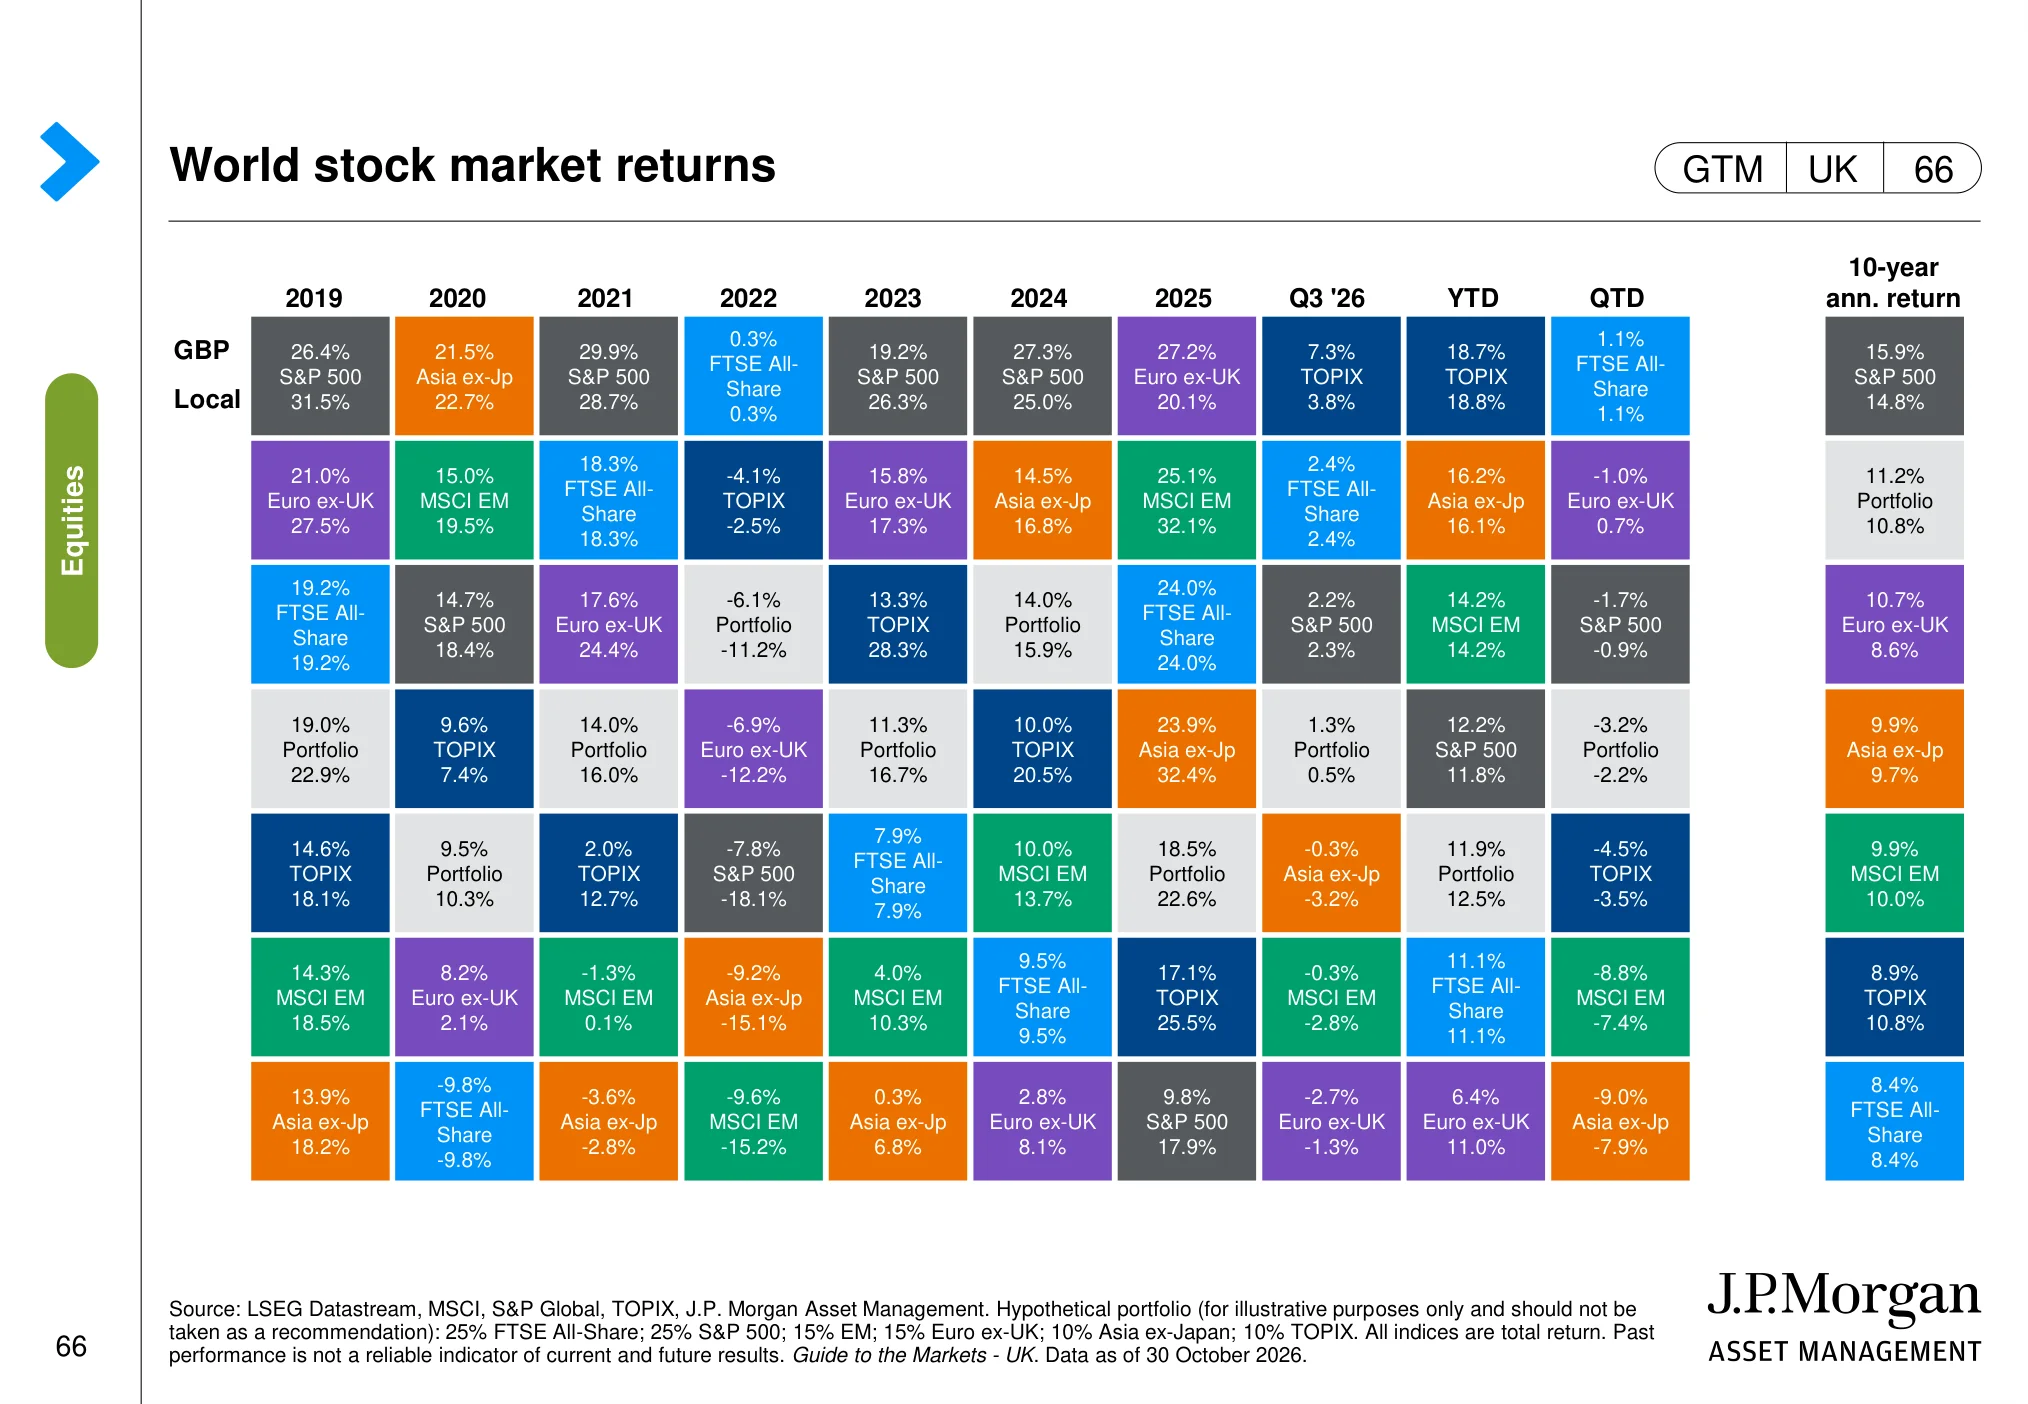
World stock market returns (page 66)
 (opens in a new tab)
The chart: The page compares stock-market returns across regions and shows how leadership has varied between markets, including the US and UK.
Why it matters: Regional returns help put US and UK performance in context and show why diversification across markets can matter.
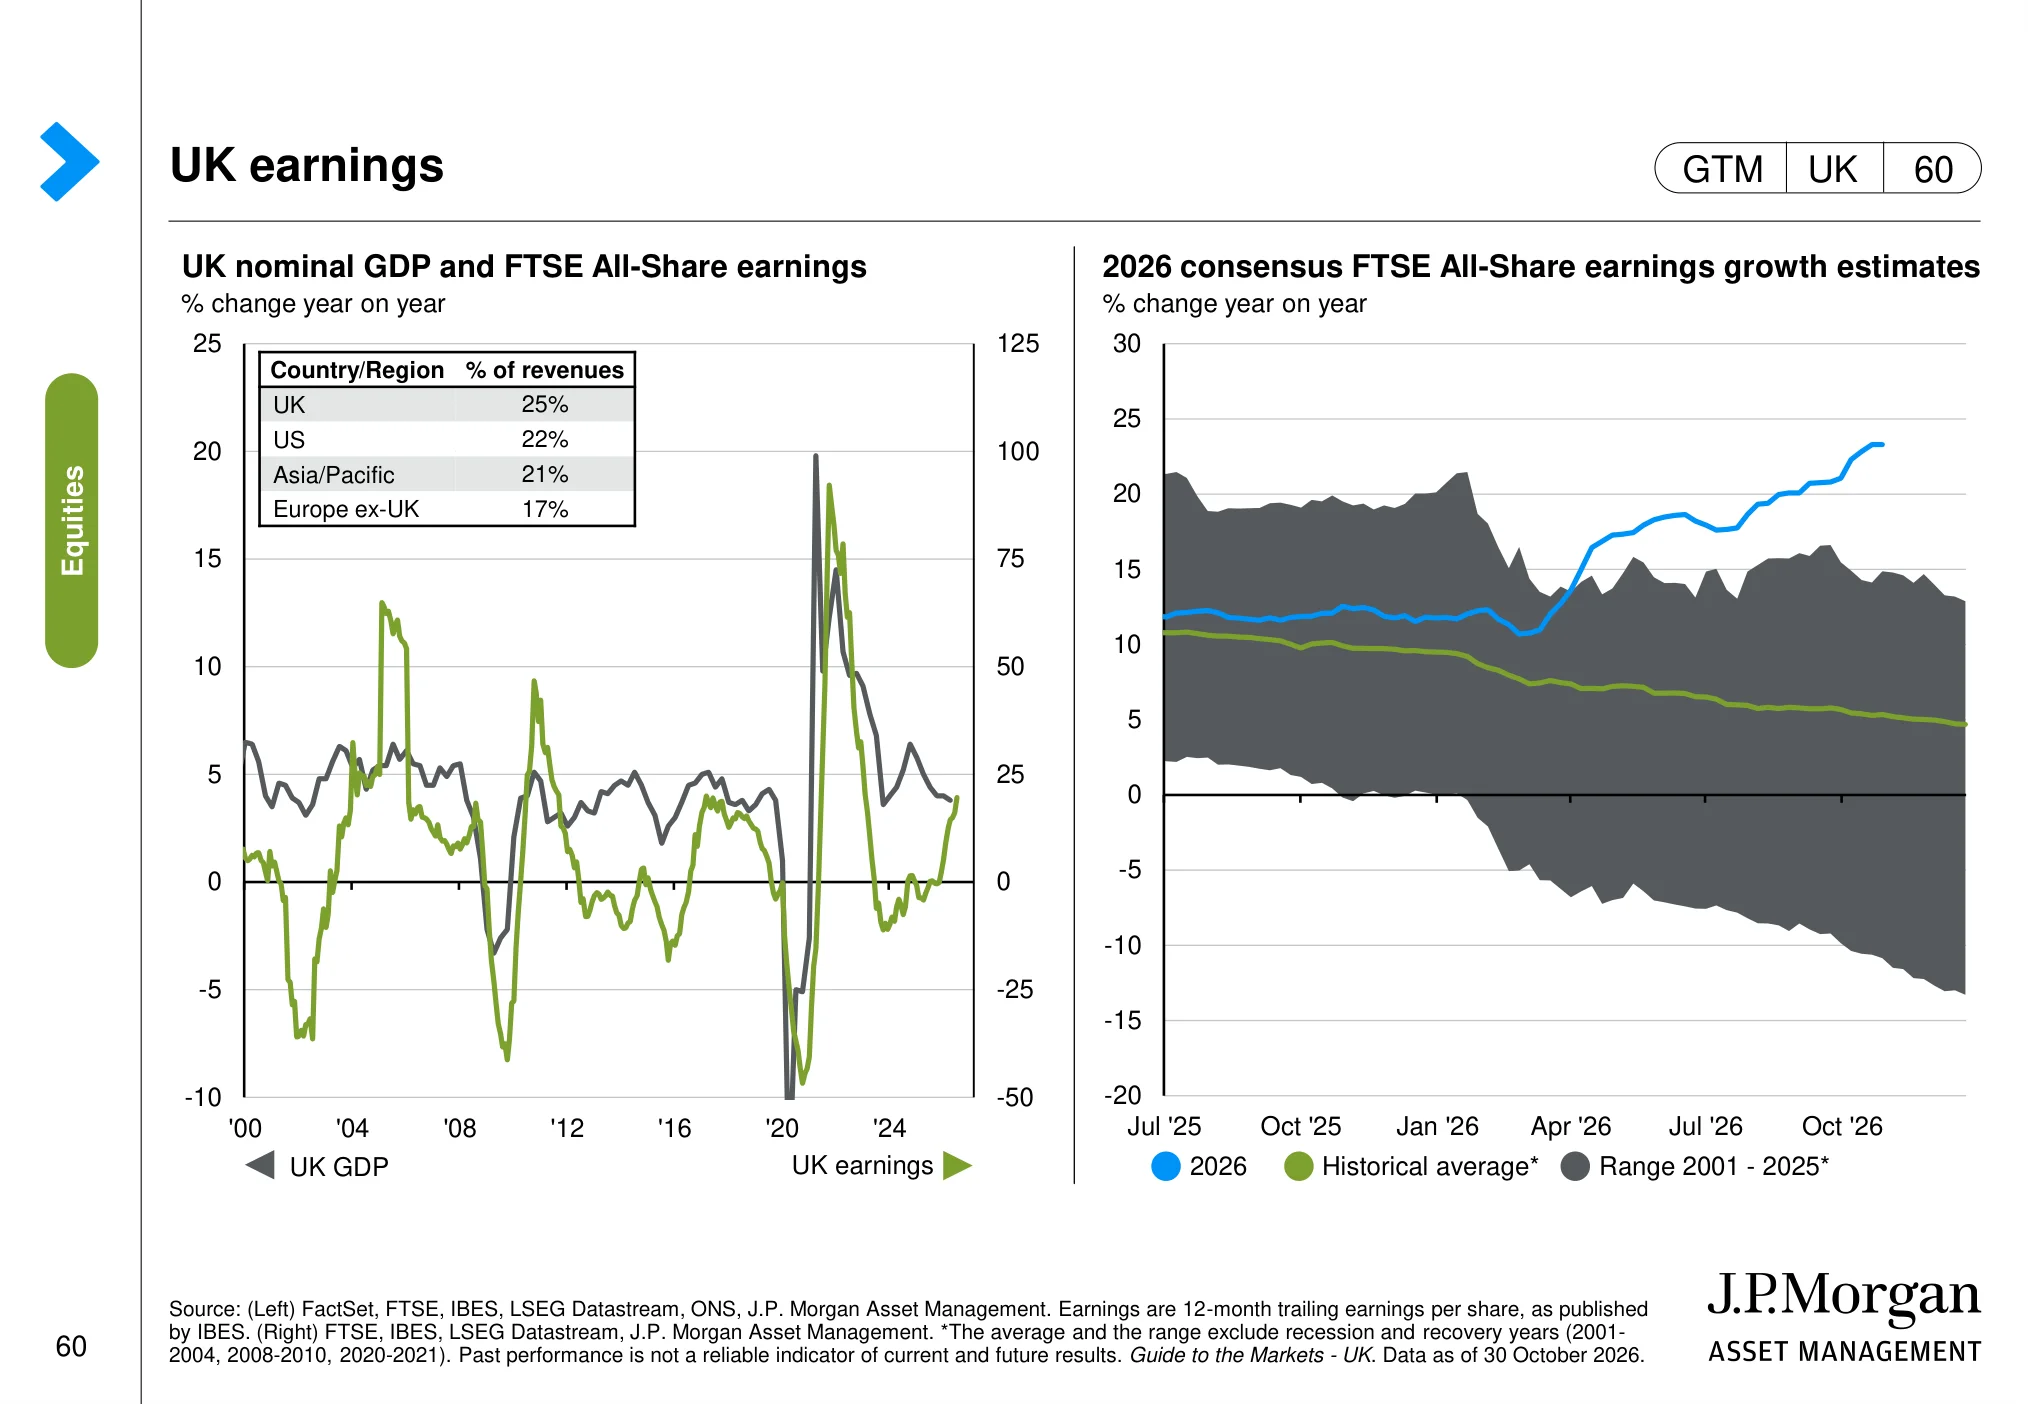
UK earnings (page 60)
 (opens in a new tab)
The chart: The charts show UK earnings trends and compare recent earnings with historical patterns. They provide a view of the direction and resilience of corporate profits.
Why it matters: UK equity performance needs to be assessed against the outlook for company earnings, not just the headline index level.
UK equity valuations (page 61)
 (opens in a new tab)
The chart: The page compares UK equity valuations across the overall market and sectors, showing differences in forward valuation multiples and relative discounts.
Why it matters: Sector-level valuation differences can reveal where UK shares look relatively expensive or inexpensive, without implying that a discount alone guarantees a recovery.
The AI trade: earnings, valuations and costs
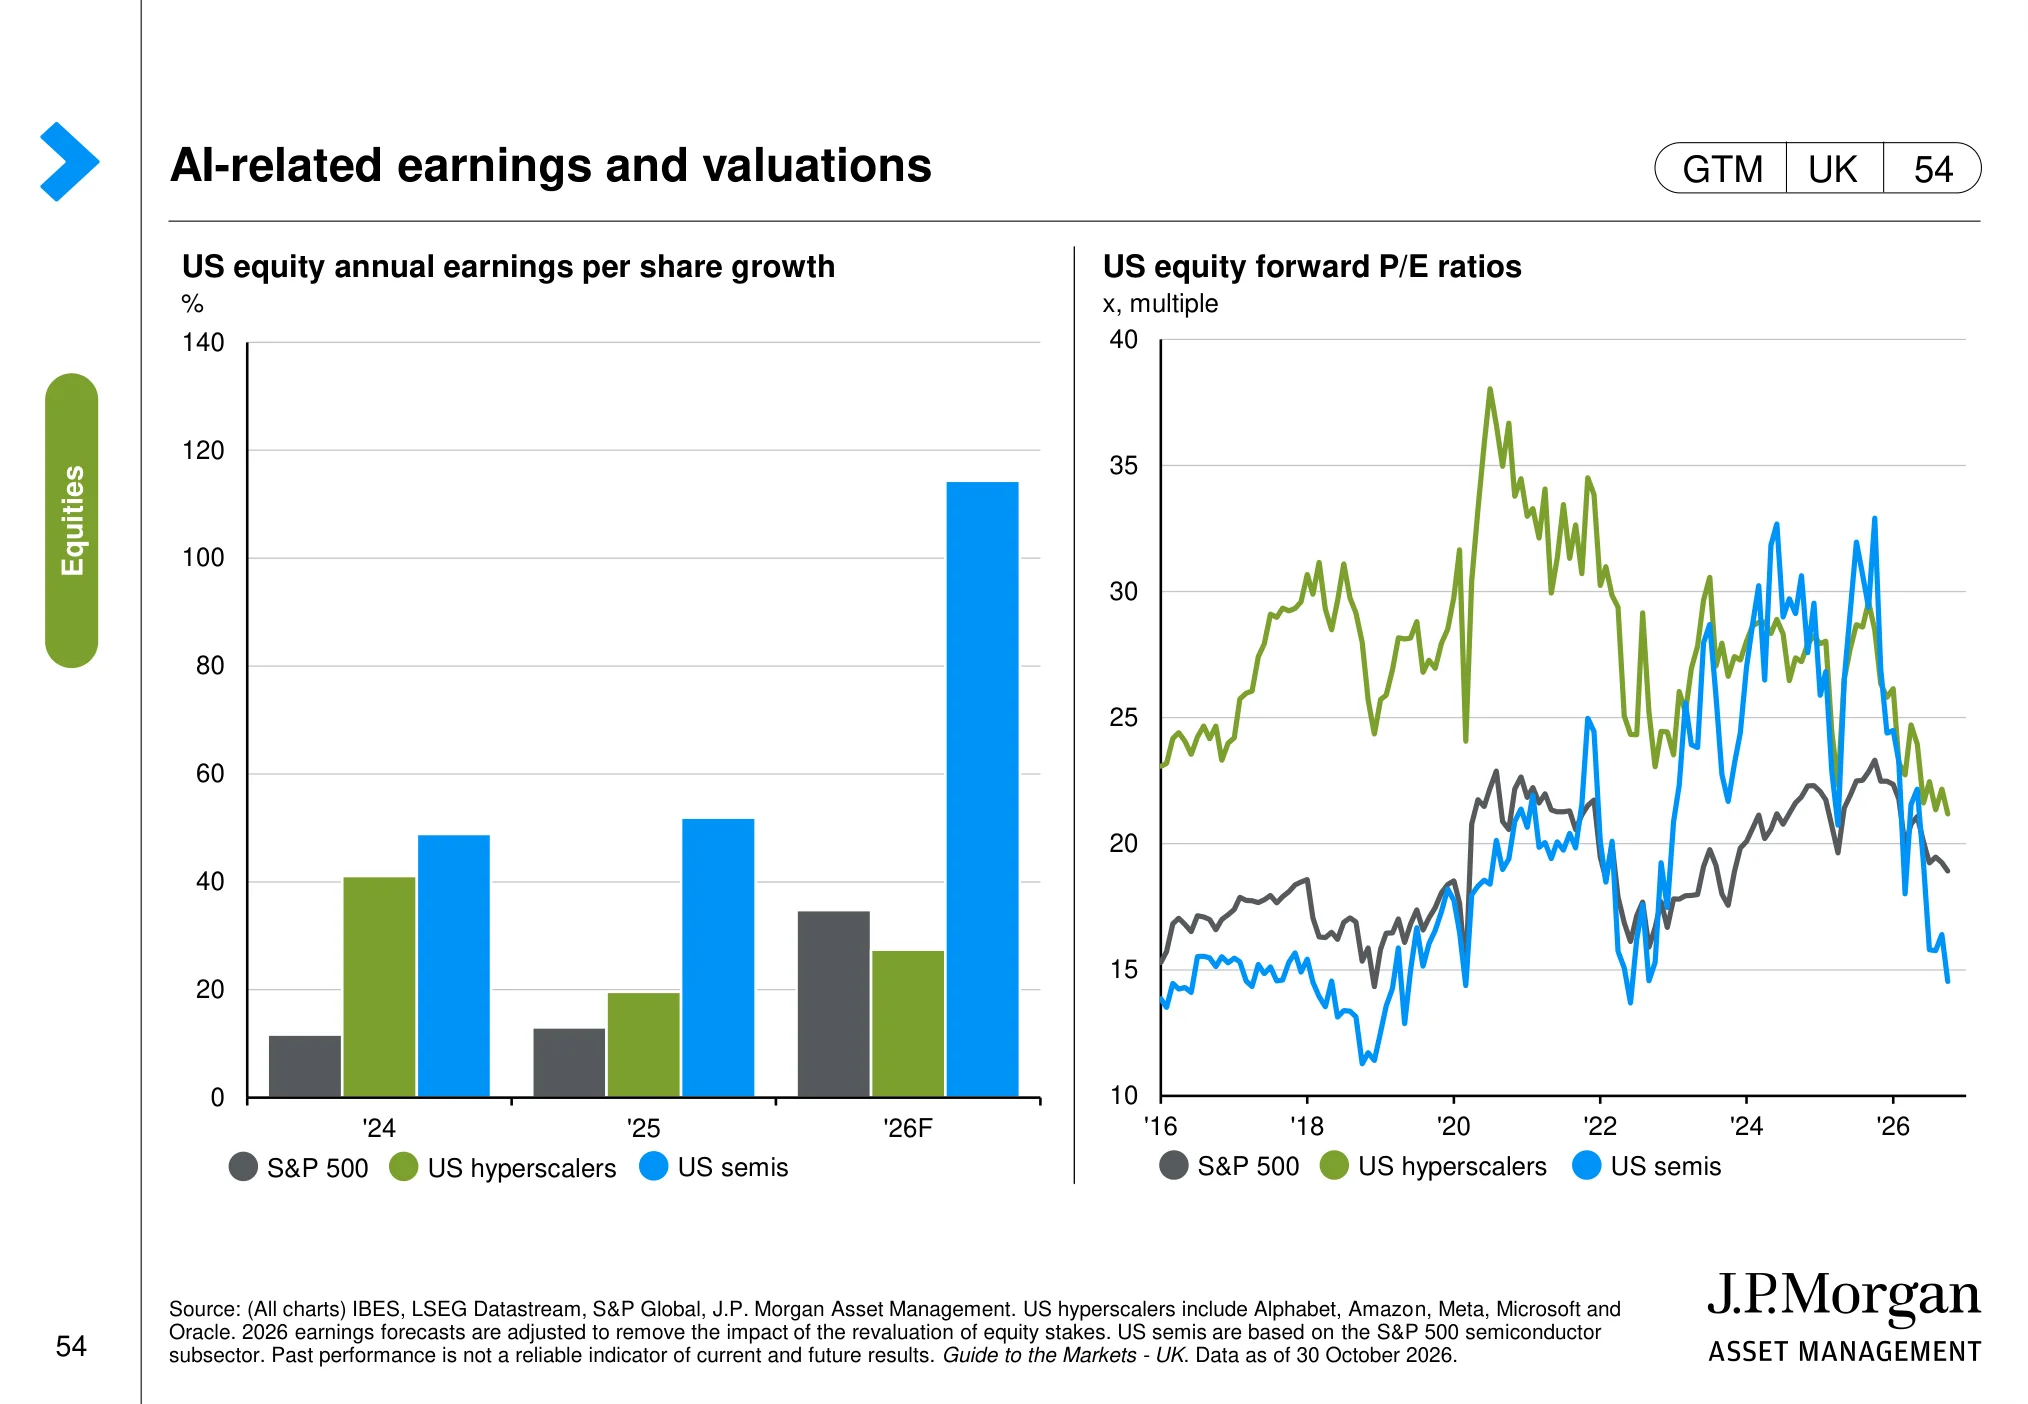
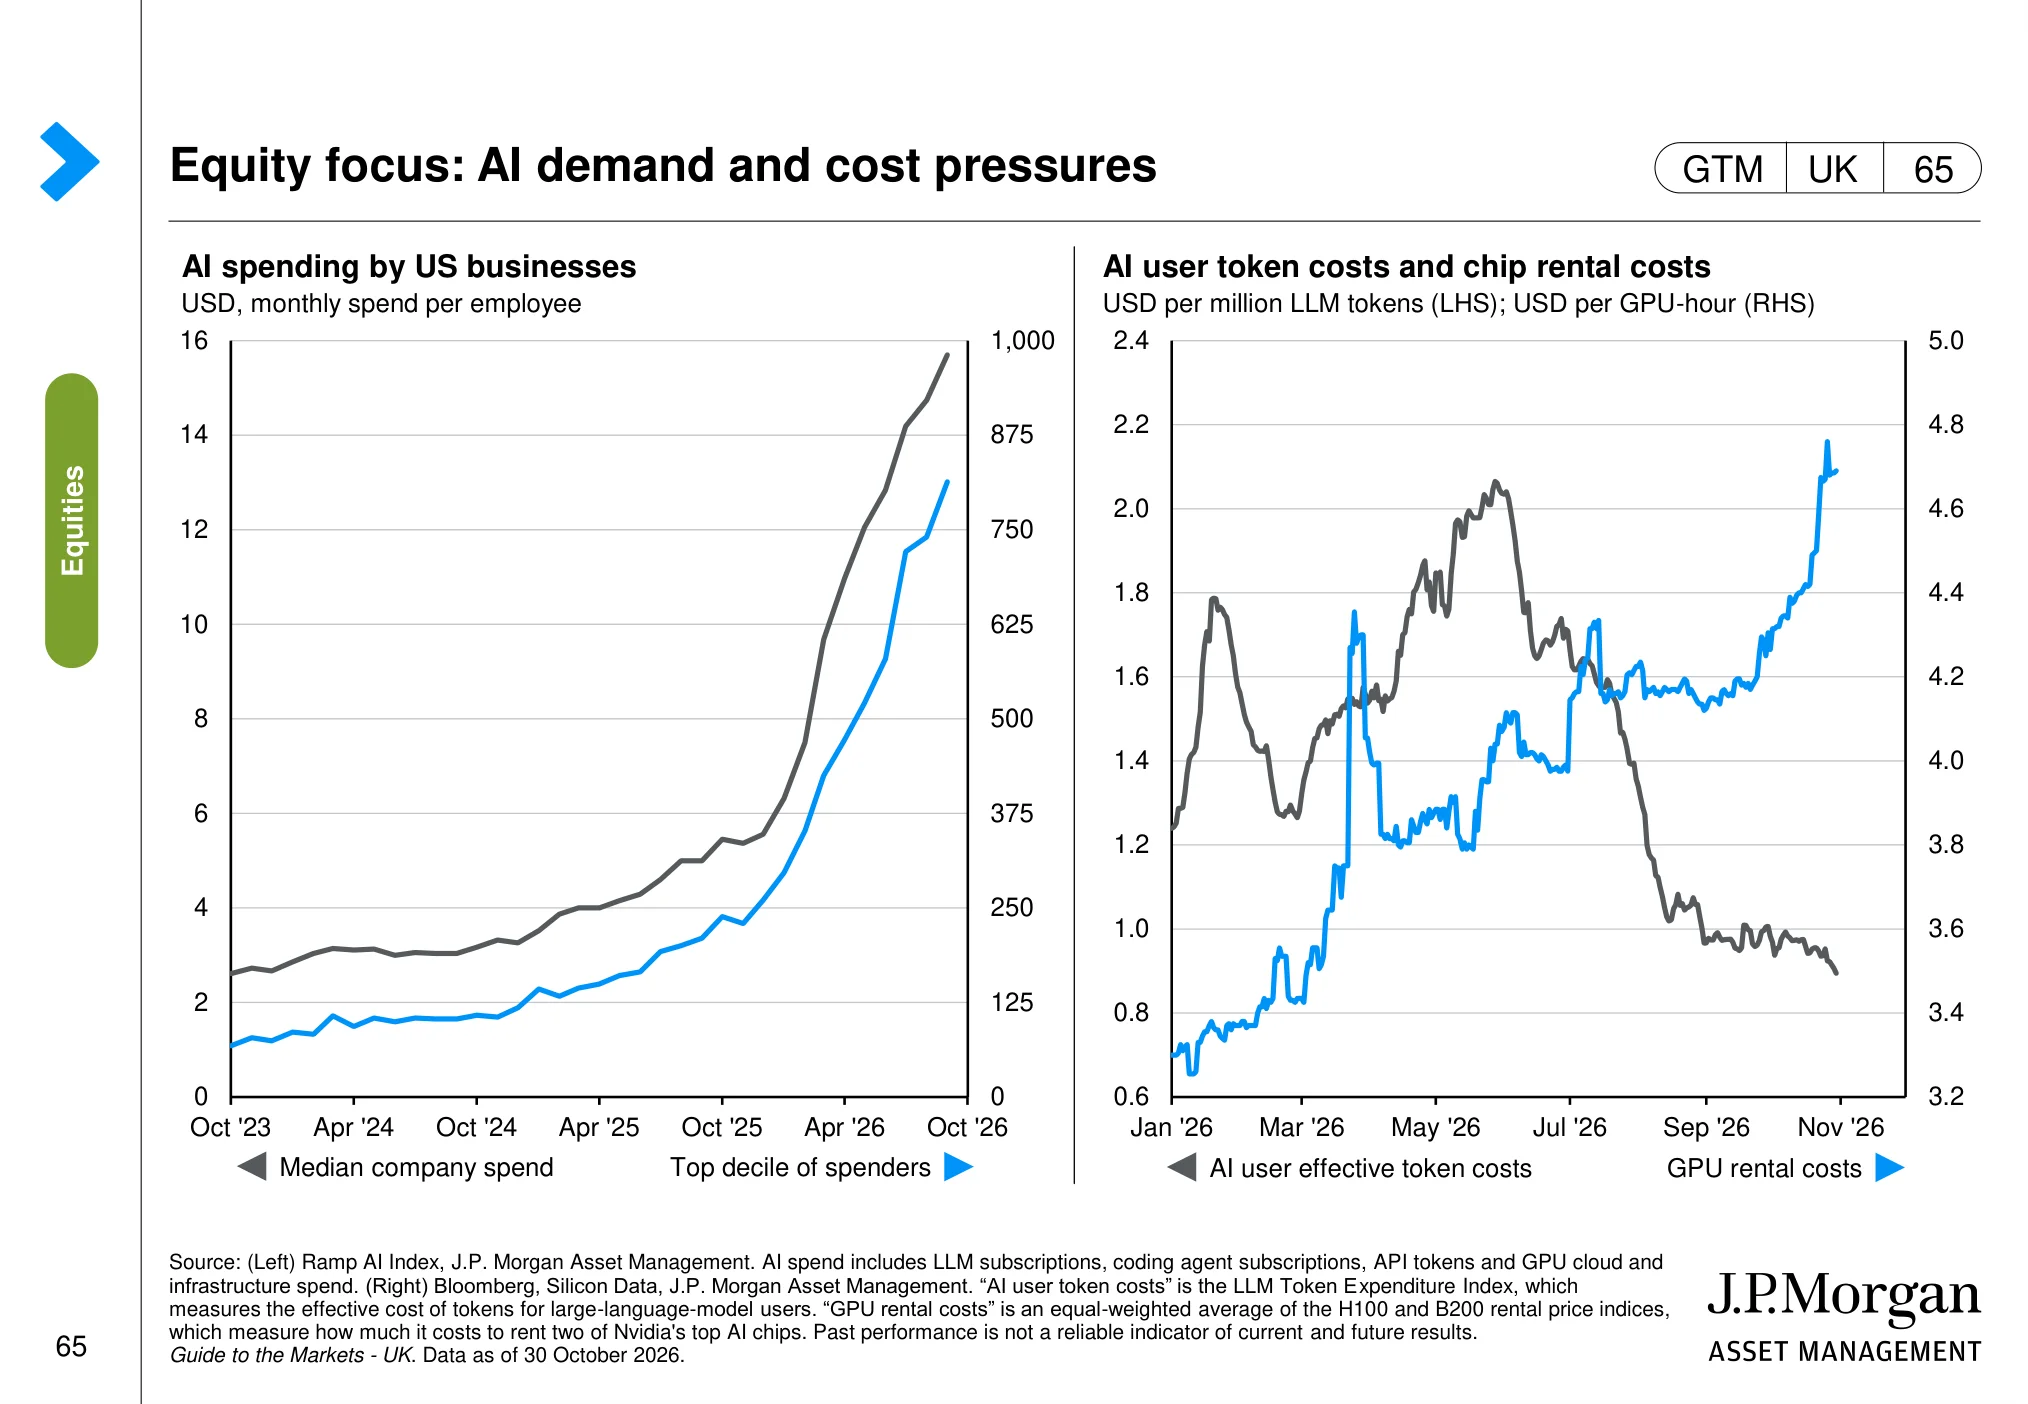
AI is now the single biggest theme in global stock markets, and not only in the US. The two slides below look at whether earnings are keeping up with the share prices, and at the economics underneath: who is spending, and how fast the cost of using AI is falling.
AI-related earnings and valuations (page 54)
 (opens in a new tab)
The chart: The charts compare AI-related earnings growth and valuations across major US technology companies and semiconductor businesses.
Why it matters: AI-related share prices need to be assessed against the earnings growth expected to justify their valuations.
Equity focus: AI demand and cost pressures (page 65)
 (opens in a new tab)
The chart: The page examines AI demand and cost pressures, including spending on AI services and the changing cost of using AI models.
Why it matters: Falling AI usage costs and rising adoption can broaden use cases, while the economics of infrastructure and providers remain important to monitor.
Investing principles: what 100 years of data teaches
The final eight slides are the ones I would print and pin above the desk. They are not about this quarter at all. They are about how markets behave over decades, and why a disciplined process matters more than any single forecast.
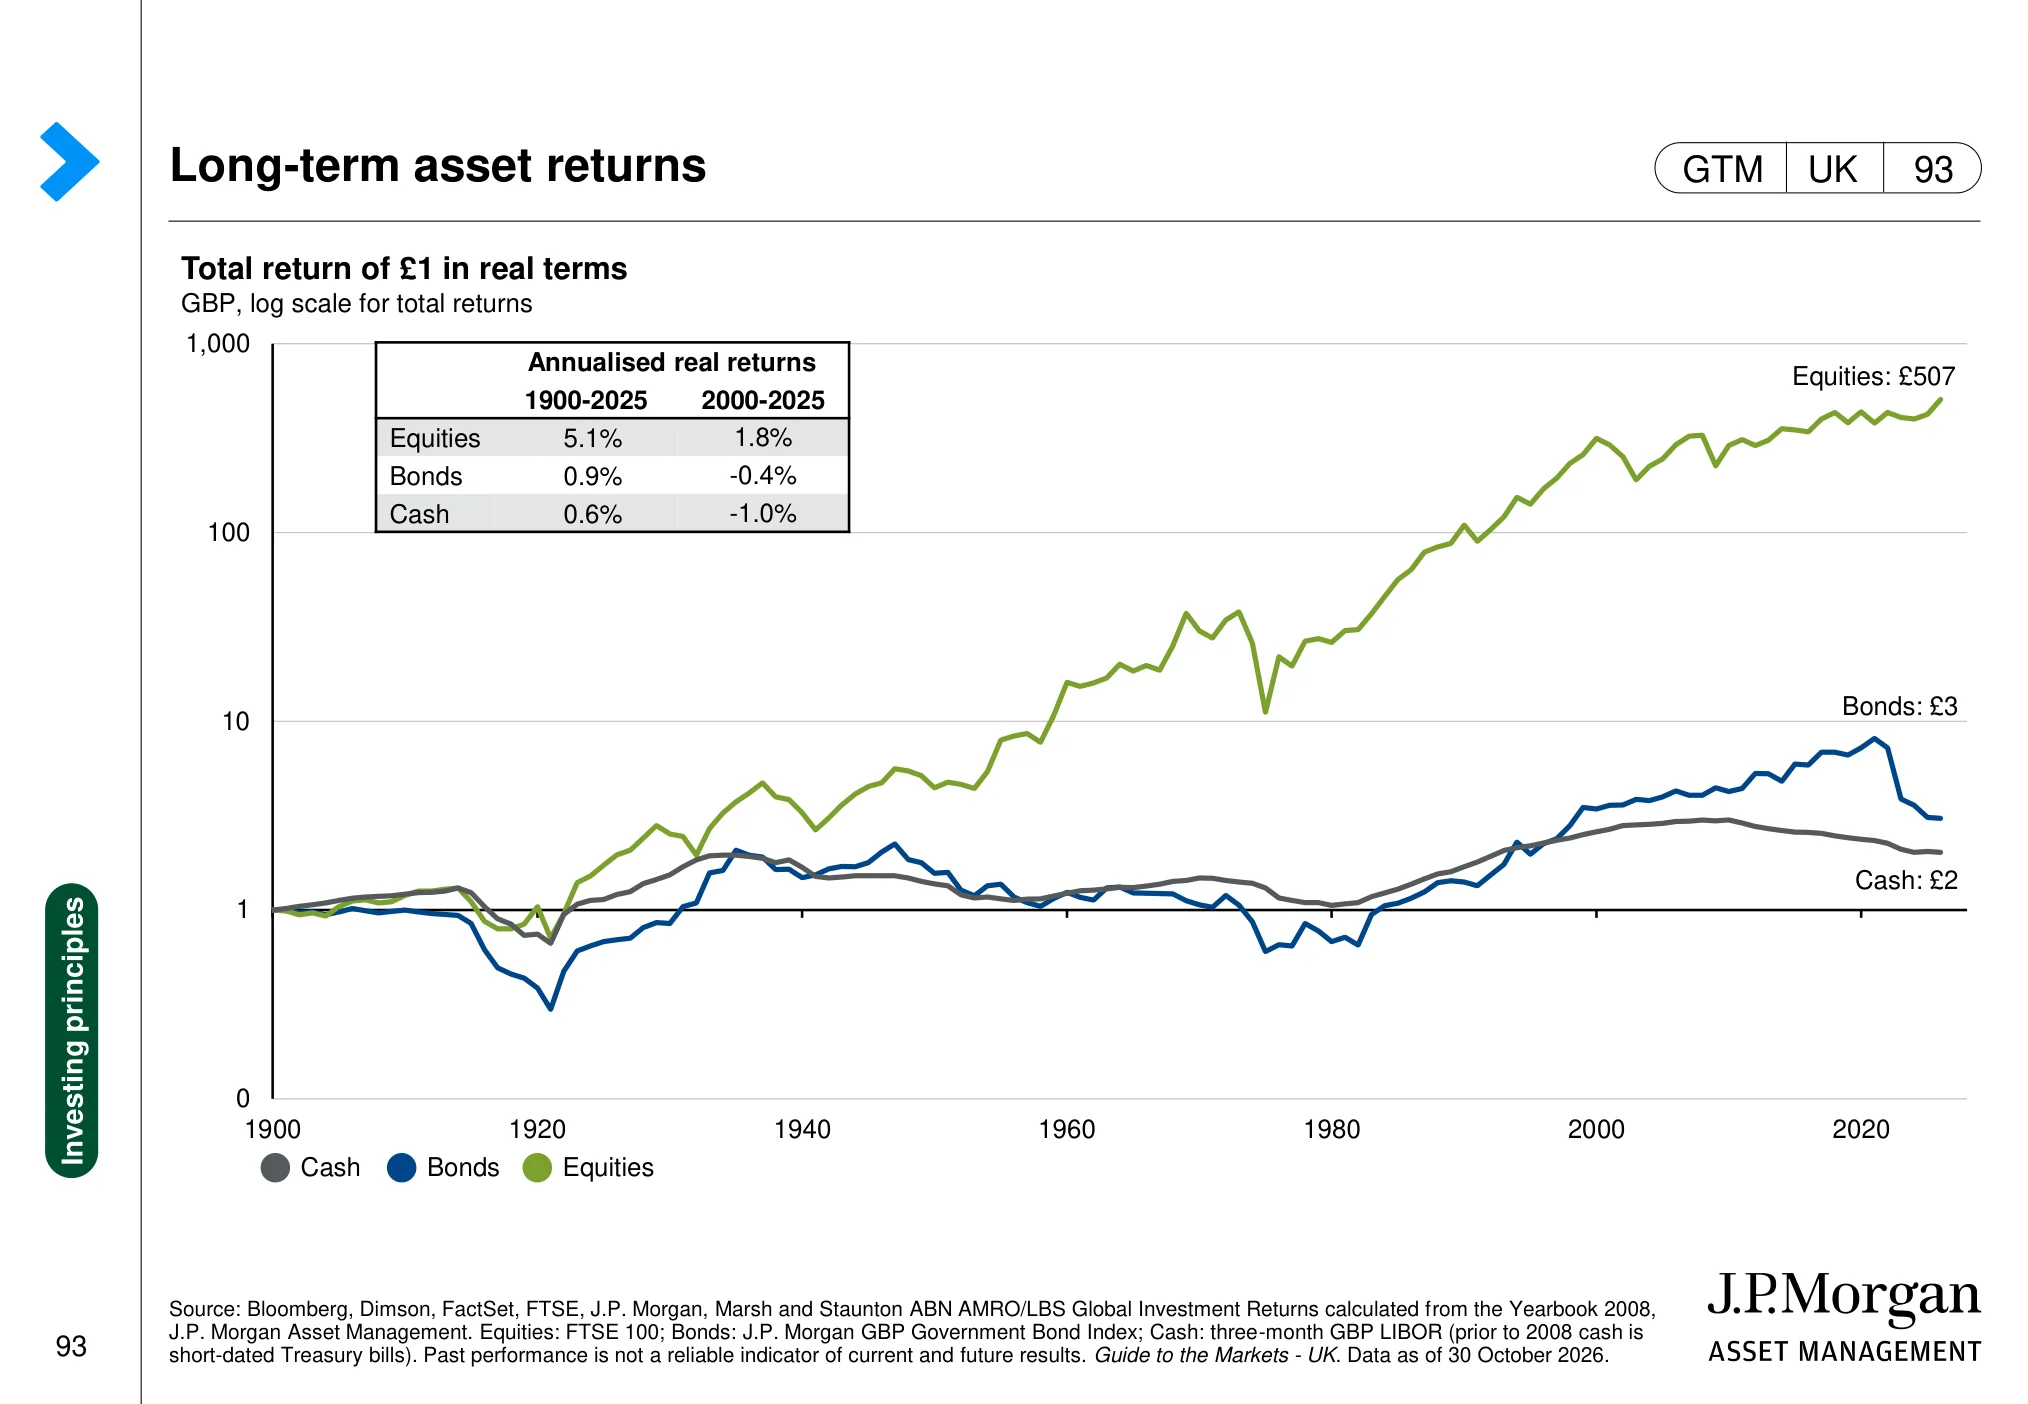
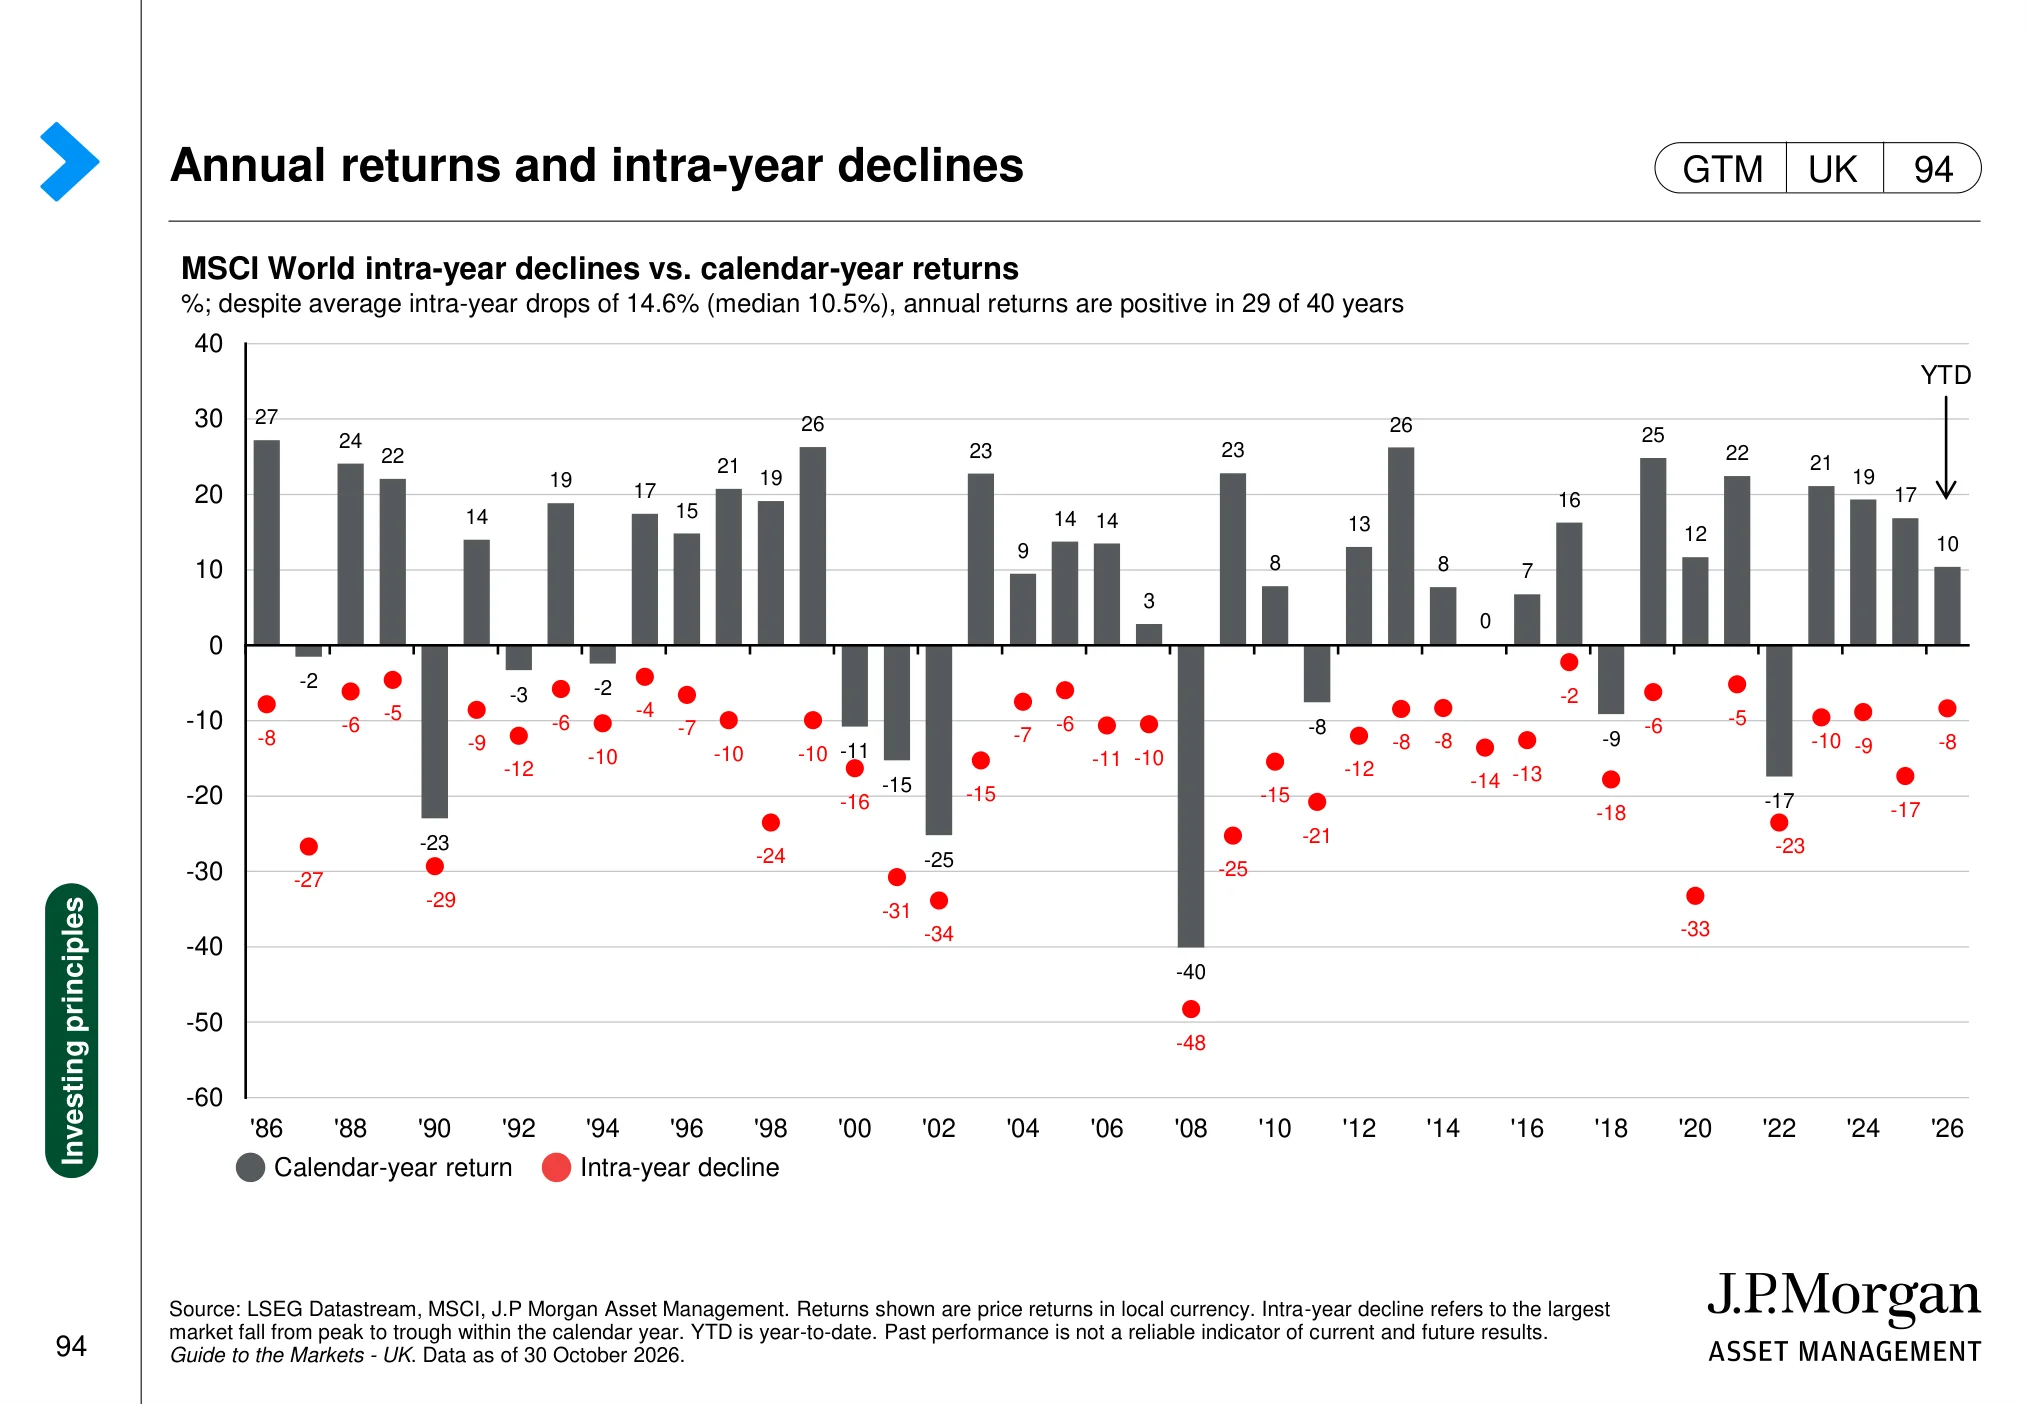
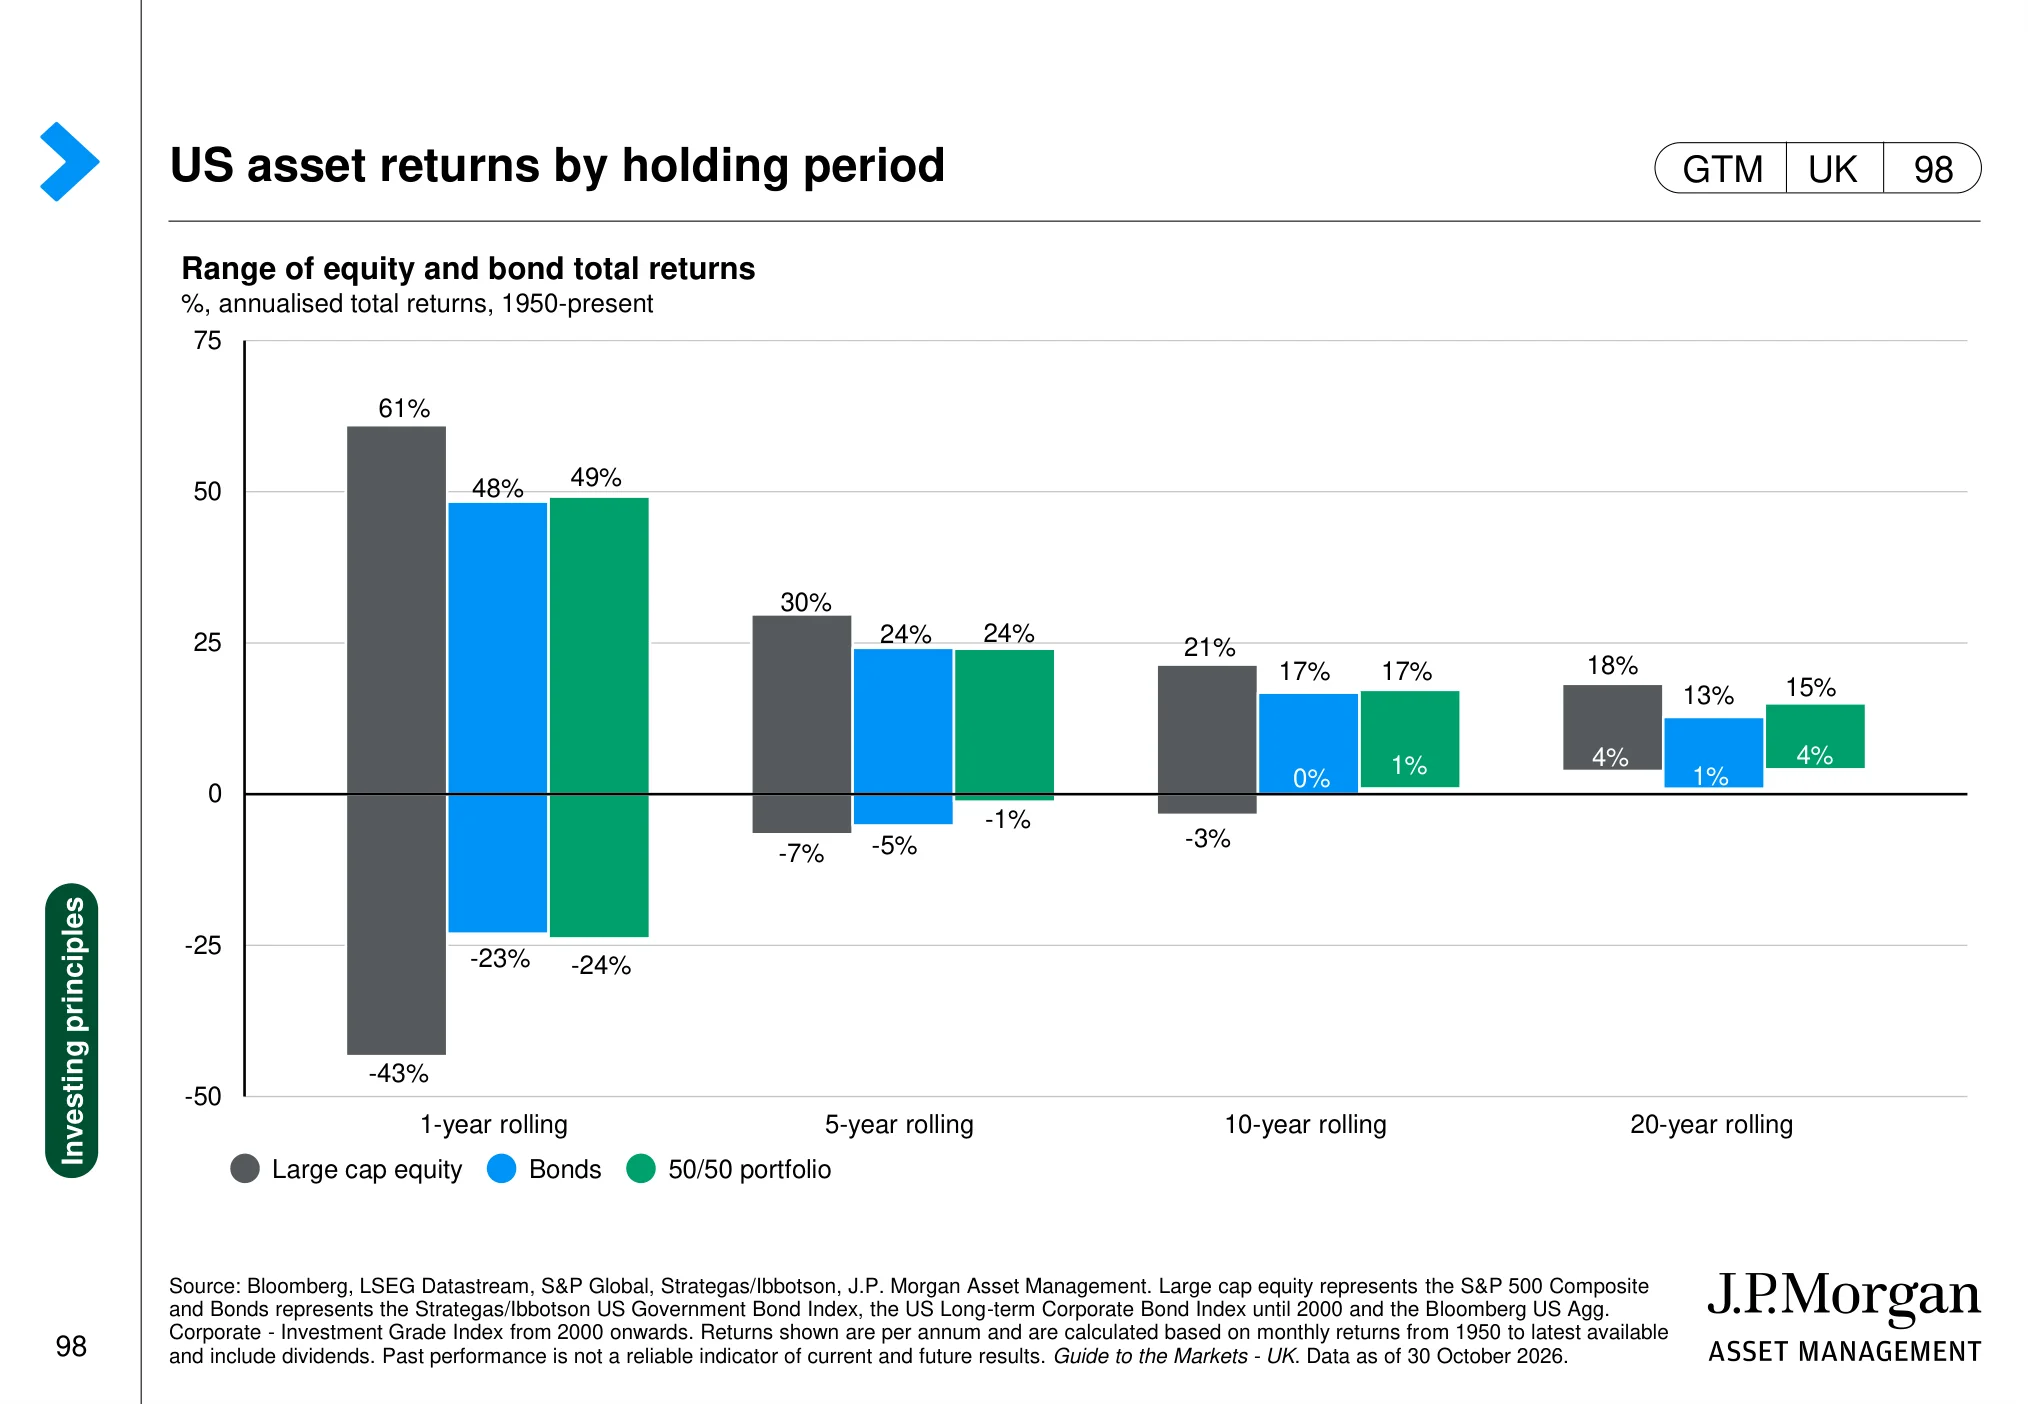
A few figures to anchor them. £1 invested in UK equities in 1900 grew to £507 in real terms, an annualised real return of 5.1% from 1900 to 2025, against 0.9% for bonds and 0.6% for cash. Over 2000 to 2025, though, UK equities returned just 1.8% a year after inflation, and cash lost 1.0% a year. MSCI World suffered an average intra-year fall of 14.6% over the past 40 years, yet ended the year higher in 29 of them. And in US data since 1950, one-year returns for large-cap shares ranged from +61% to -43%, while the worst 20-year rolling period still returned +4% a year.
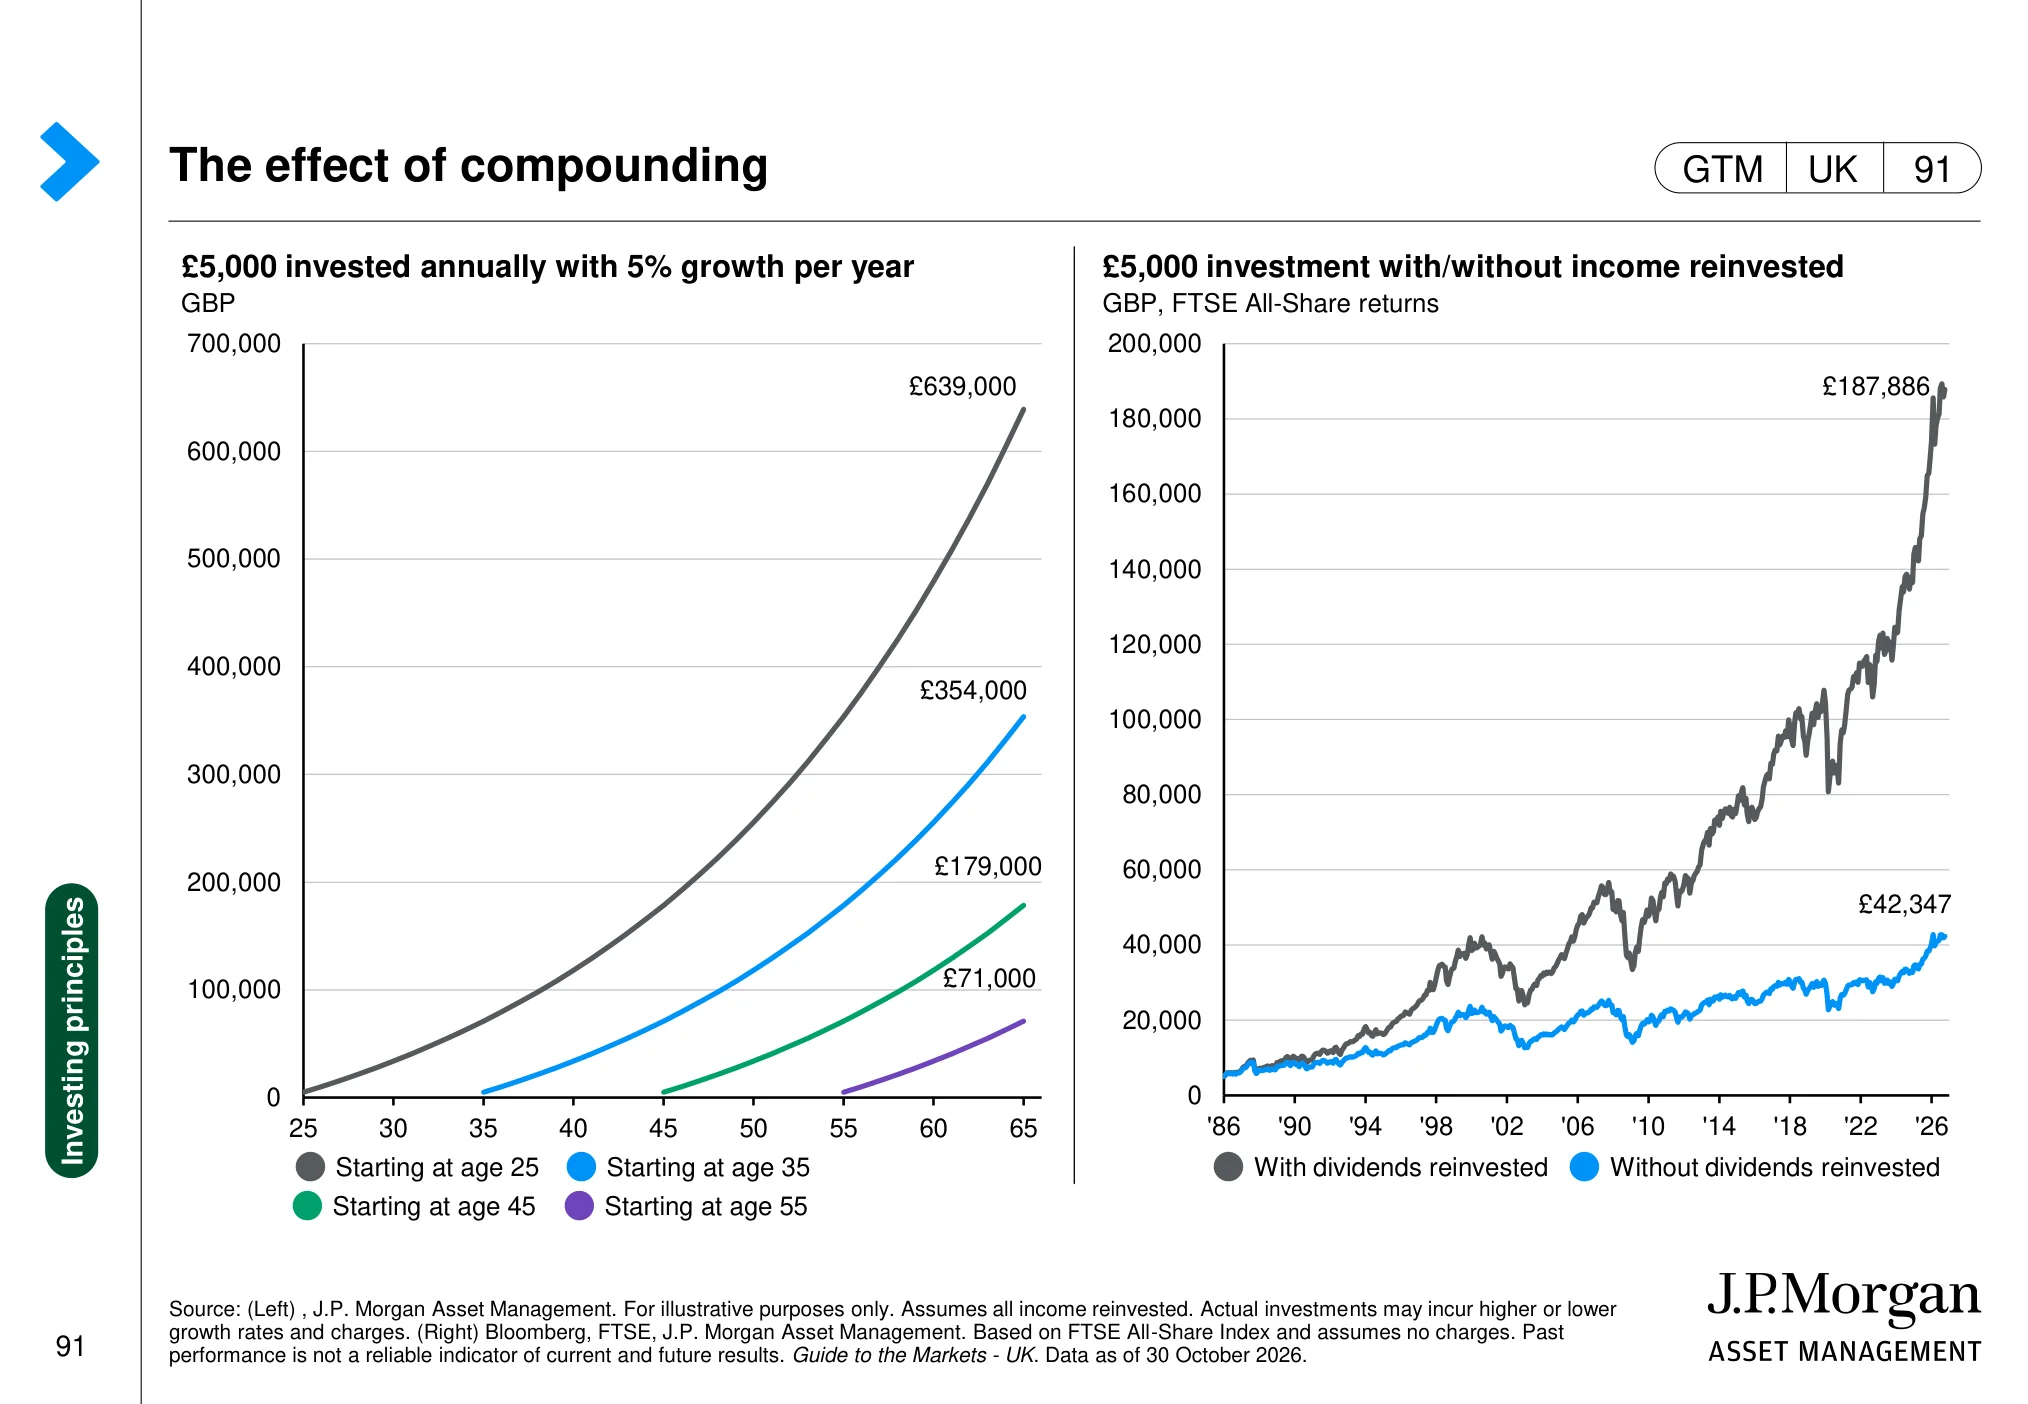
The effect of compounding (page 91)
 (opens in a new tab)
The chart: The page illustrates the effect of compounding over time and the difference reinvestment can make to the growth of an investment.
Why it matters: Compounding rewards time in the market, particularly when investment income is reinvested.
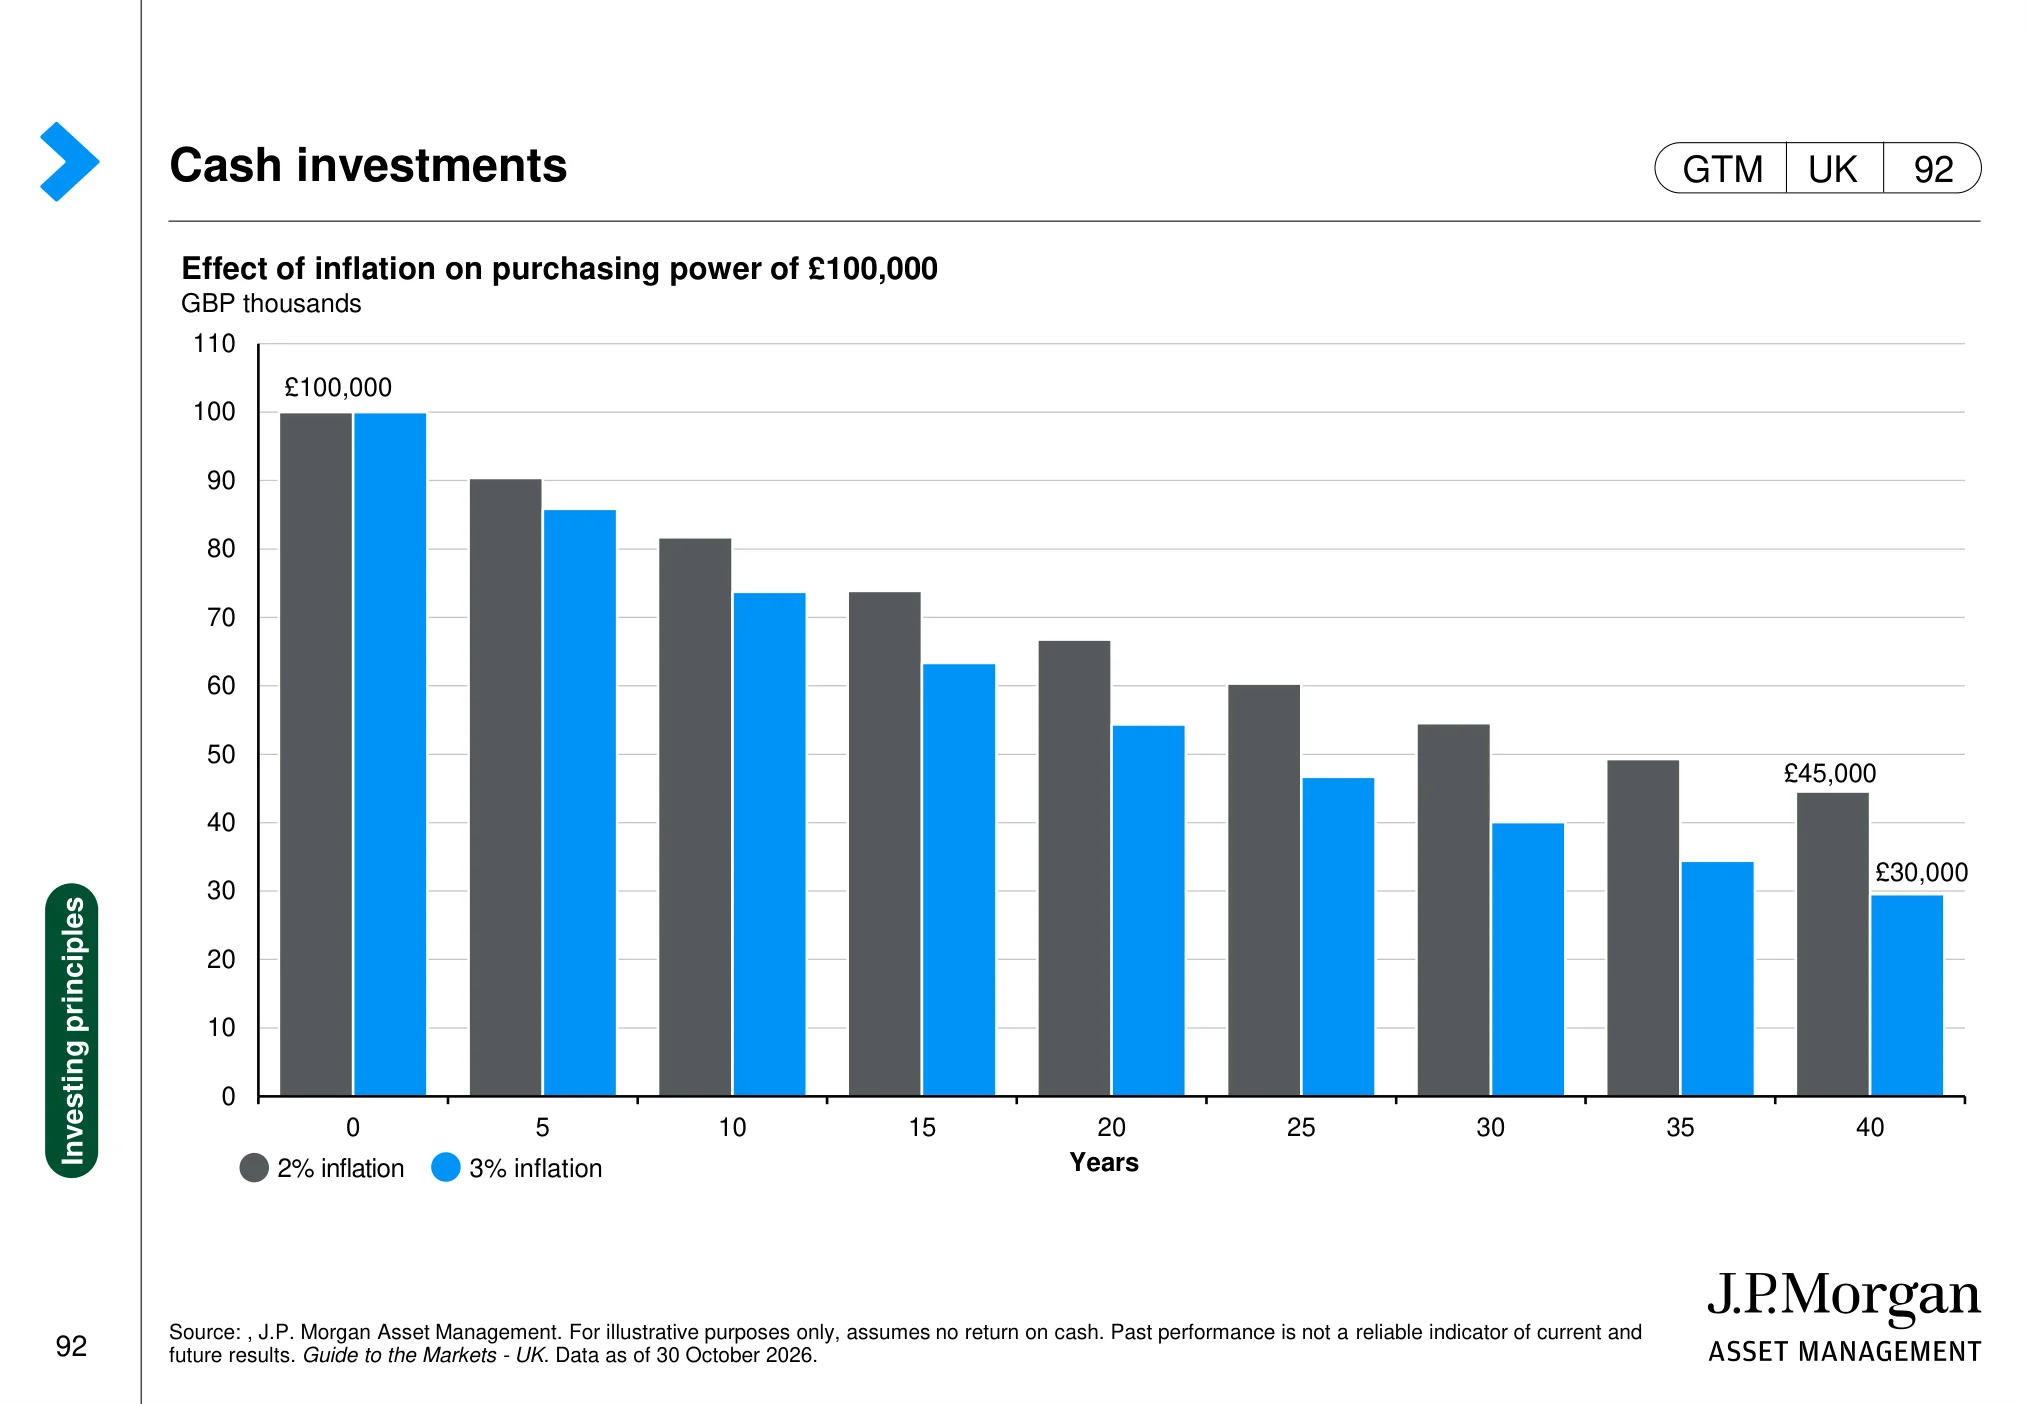
Cash investments (page 92)
 (opens in a new tab)
The chart: The chart shows how inflation erodes the purchasing power of a fixed cash amount over time under different inflation assumptions.
Why it matters: Cash can provide stability and liquidity, but holding too much for too long can reduce real purchasing power.
Long-term asset returns (page 93)
 (opens in a new tab)
The chart: The chart compares the long-term real value of £1 invested in UK equities, bonds and cash over an extended historical period.
Why it matters: Long-term returns show why asset choice and investment horizon matter when trying to grow wealth above inflation.
Annual returns and intra-year declines (page 94)
 (opens in a new tab)
The chart: The page compares annual global equity returns with the intra-year declines investors experienced along the way.
Why it matters: A positive calendar-year return can still include a significant market fall, so volatility should be expected rather than treated as unusual.
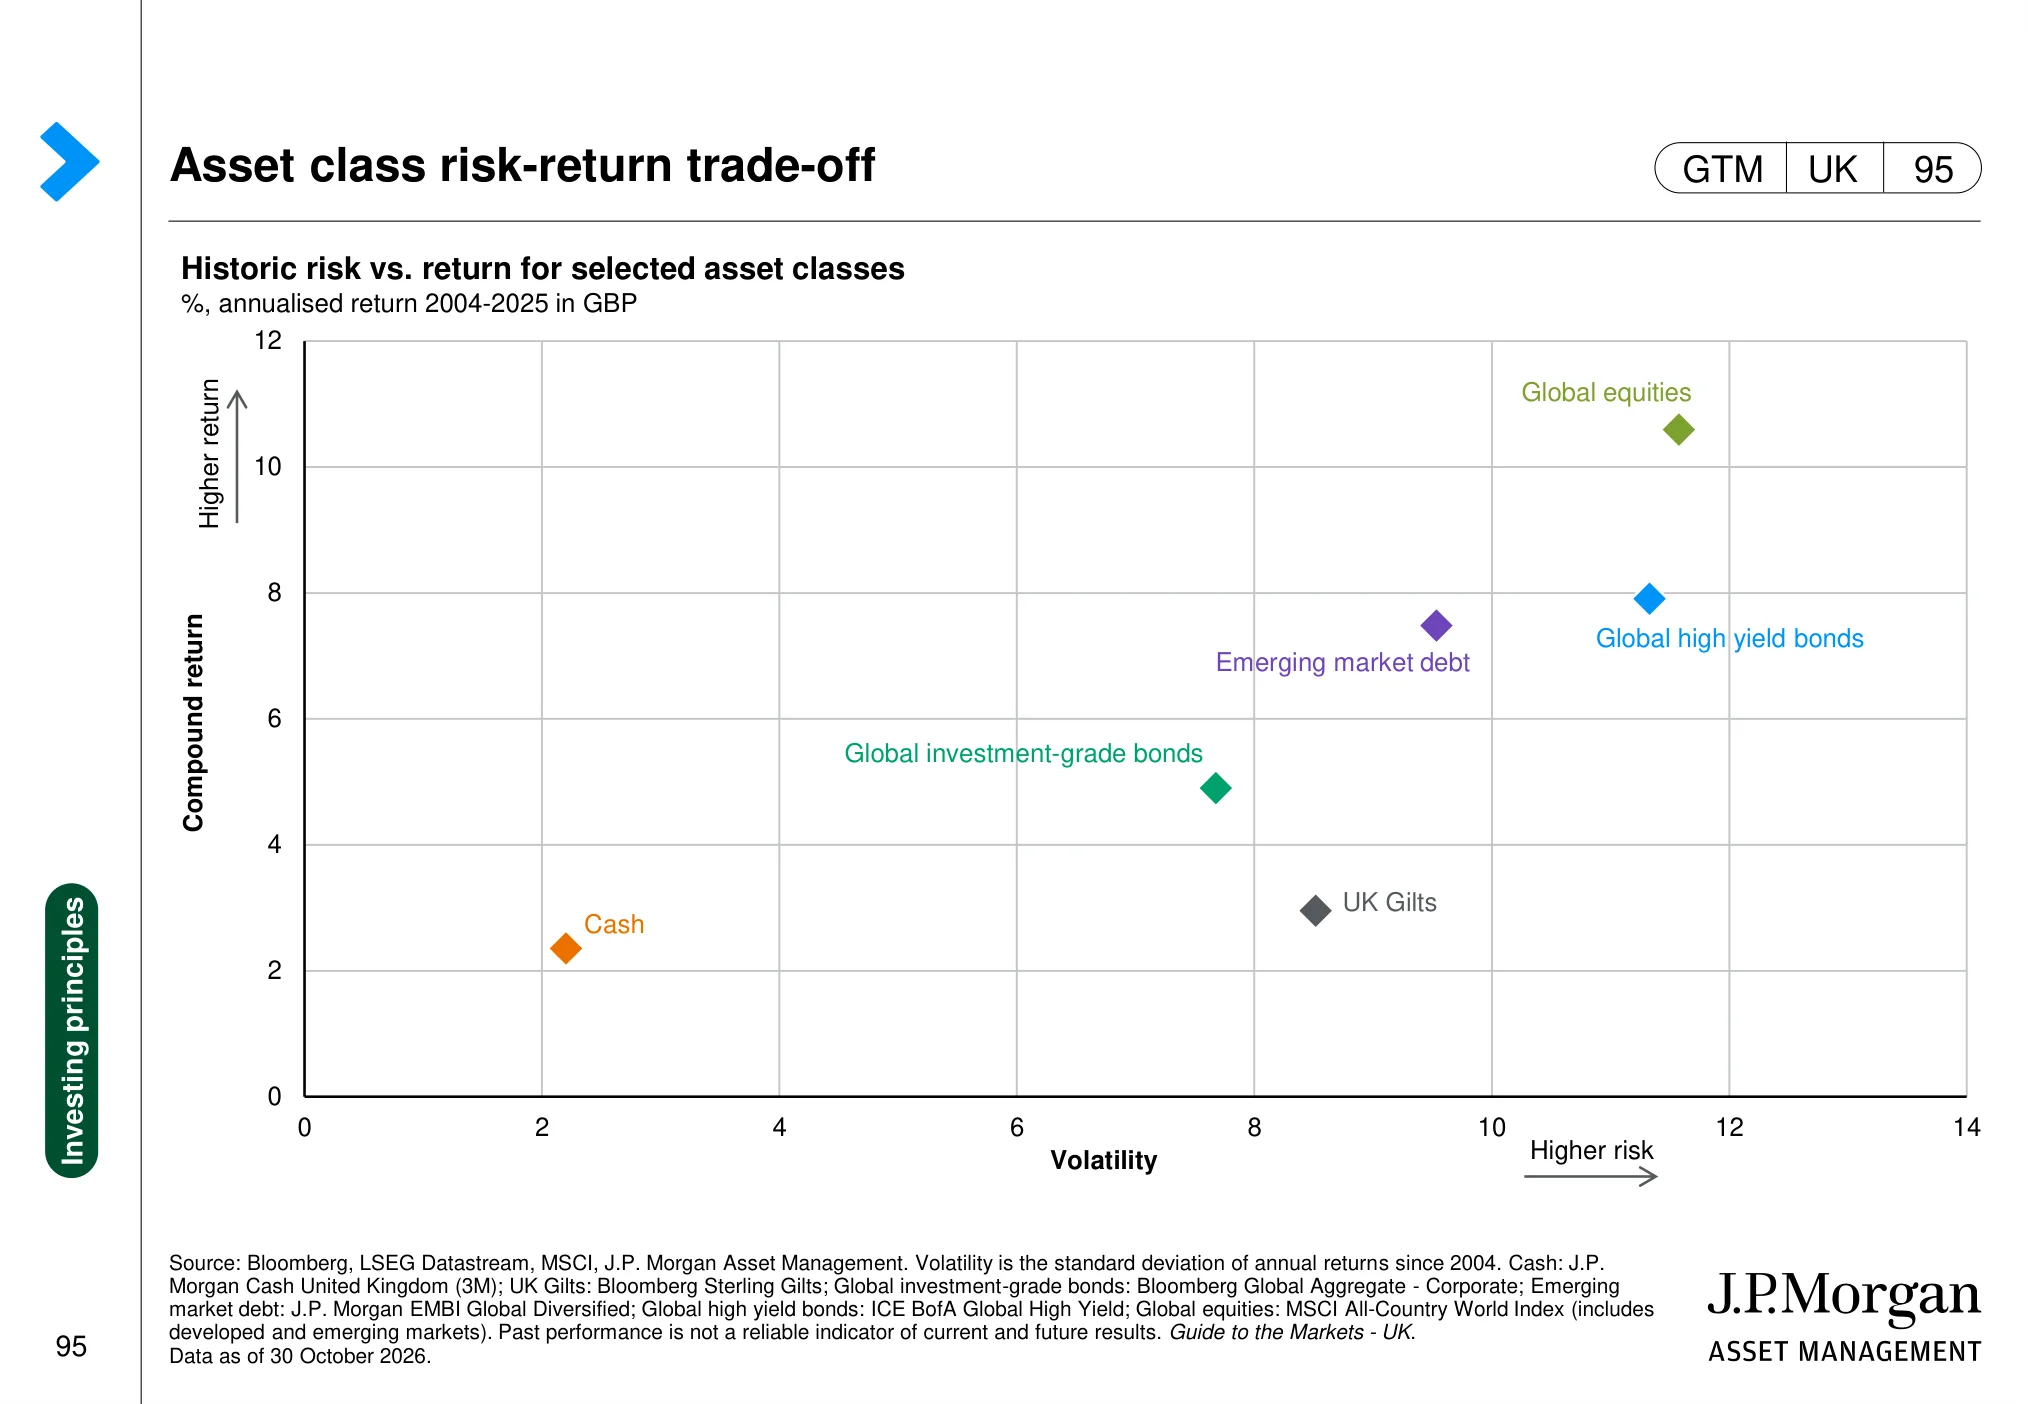
Asset class risk-return trade-off (page 95)
 (opens in a new tab)
The chart: The chart plots historic risk against return for selected asset classes, using volatility as the measure of risk.
Why it matters: Higher potential returns have historically come with higher volatility, making risk tolerance and diversification important.
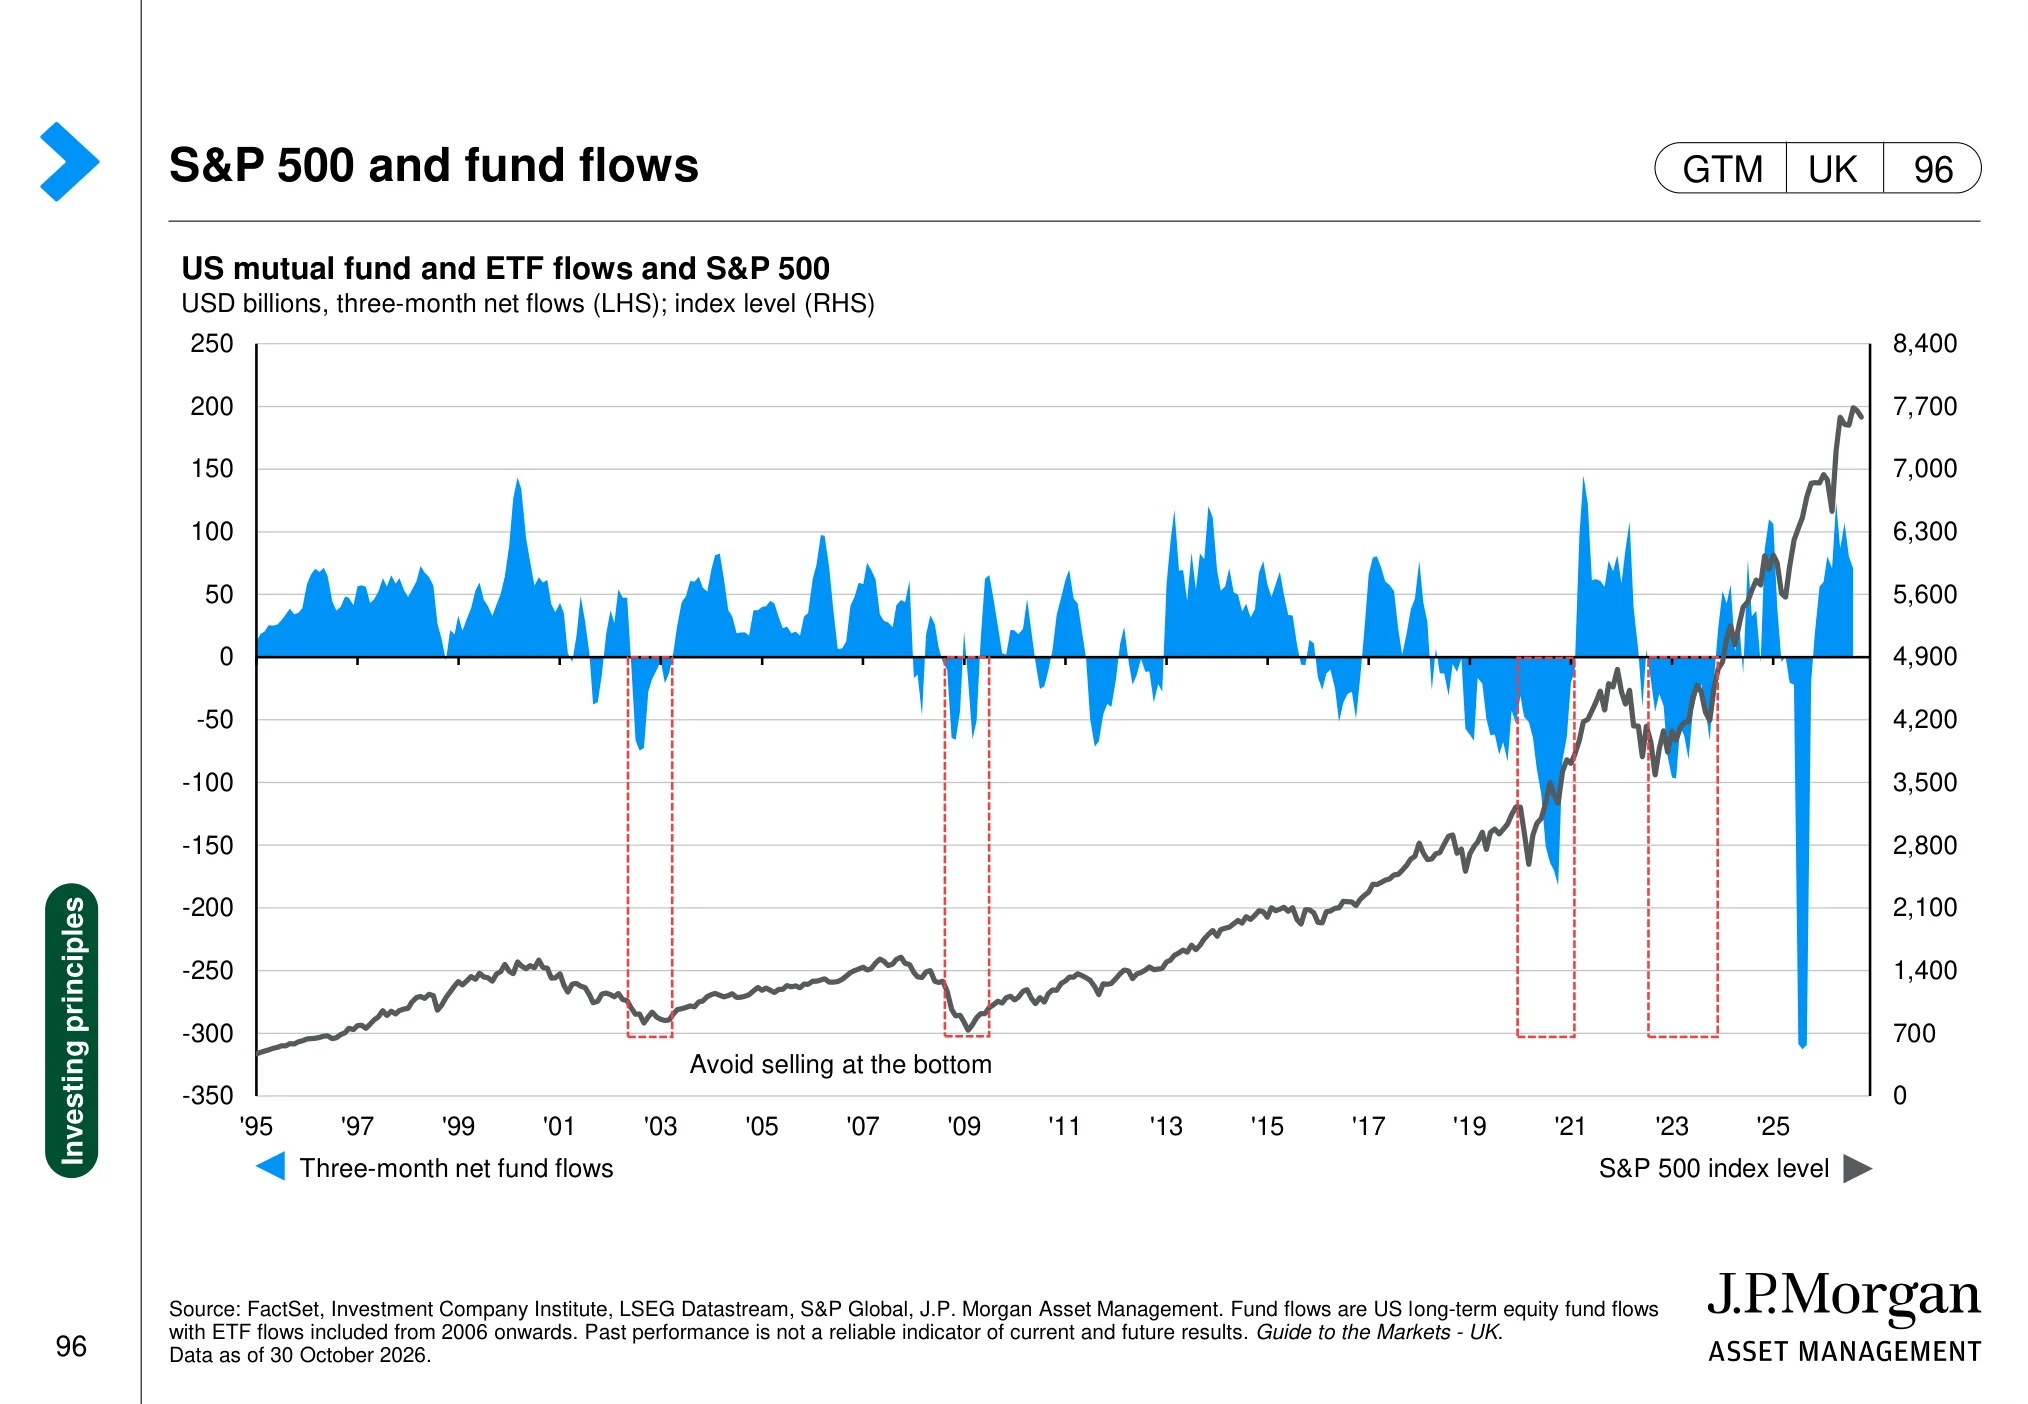
S&P 500 and fund flows (page 96)
 (opens in a new tab)
The chart: The page compares the S&P 500 with flows into US equity mutual funds and ETFs over time.
Why it matters: Fund flows can show investor demand and sentiment, but flows alone do not determine the future direction of share prices.
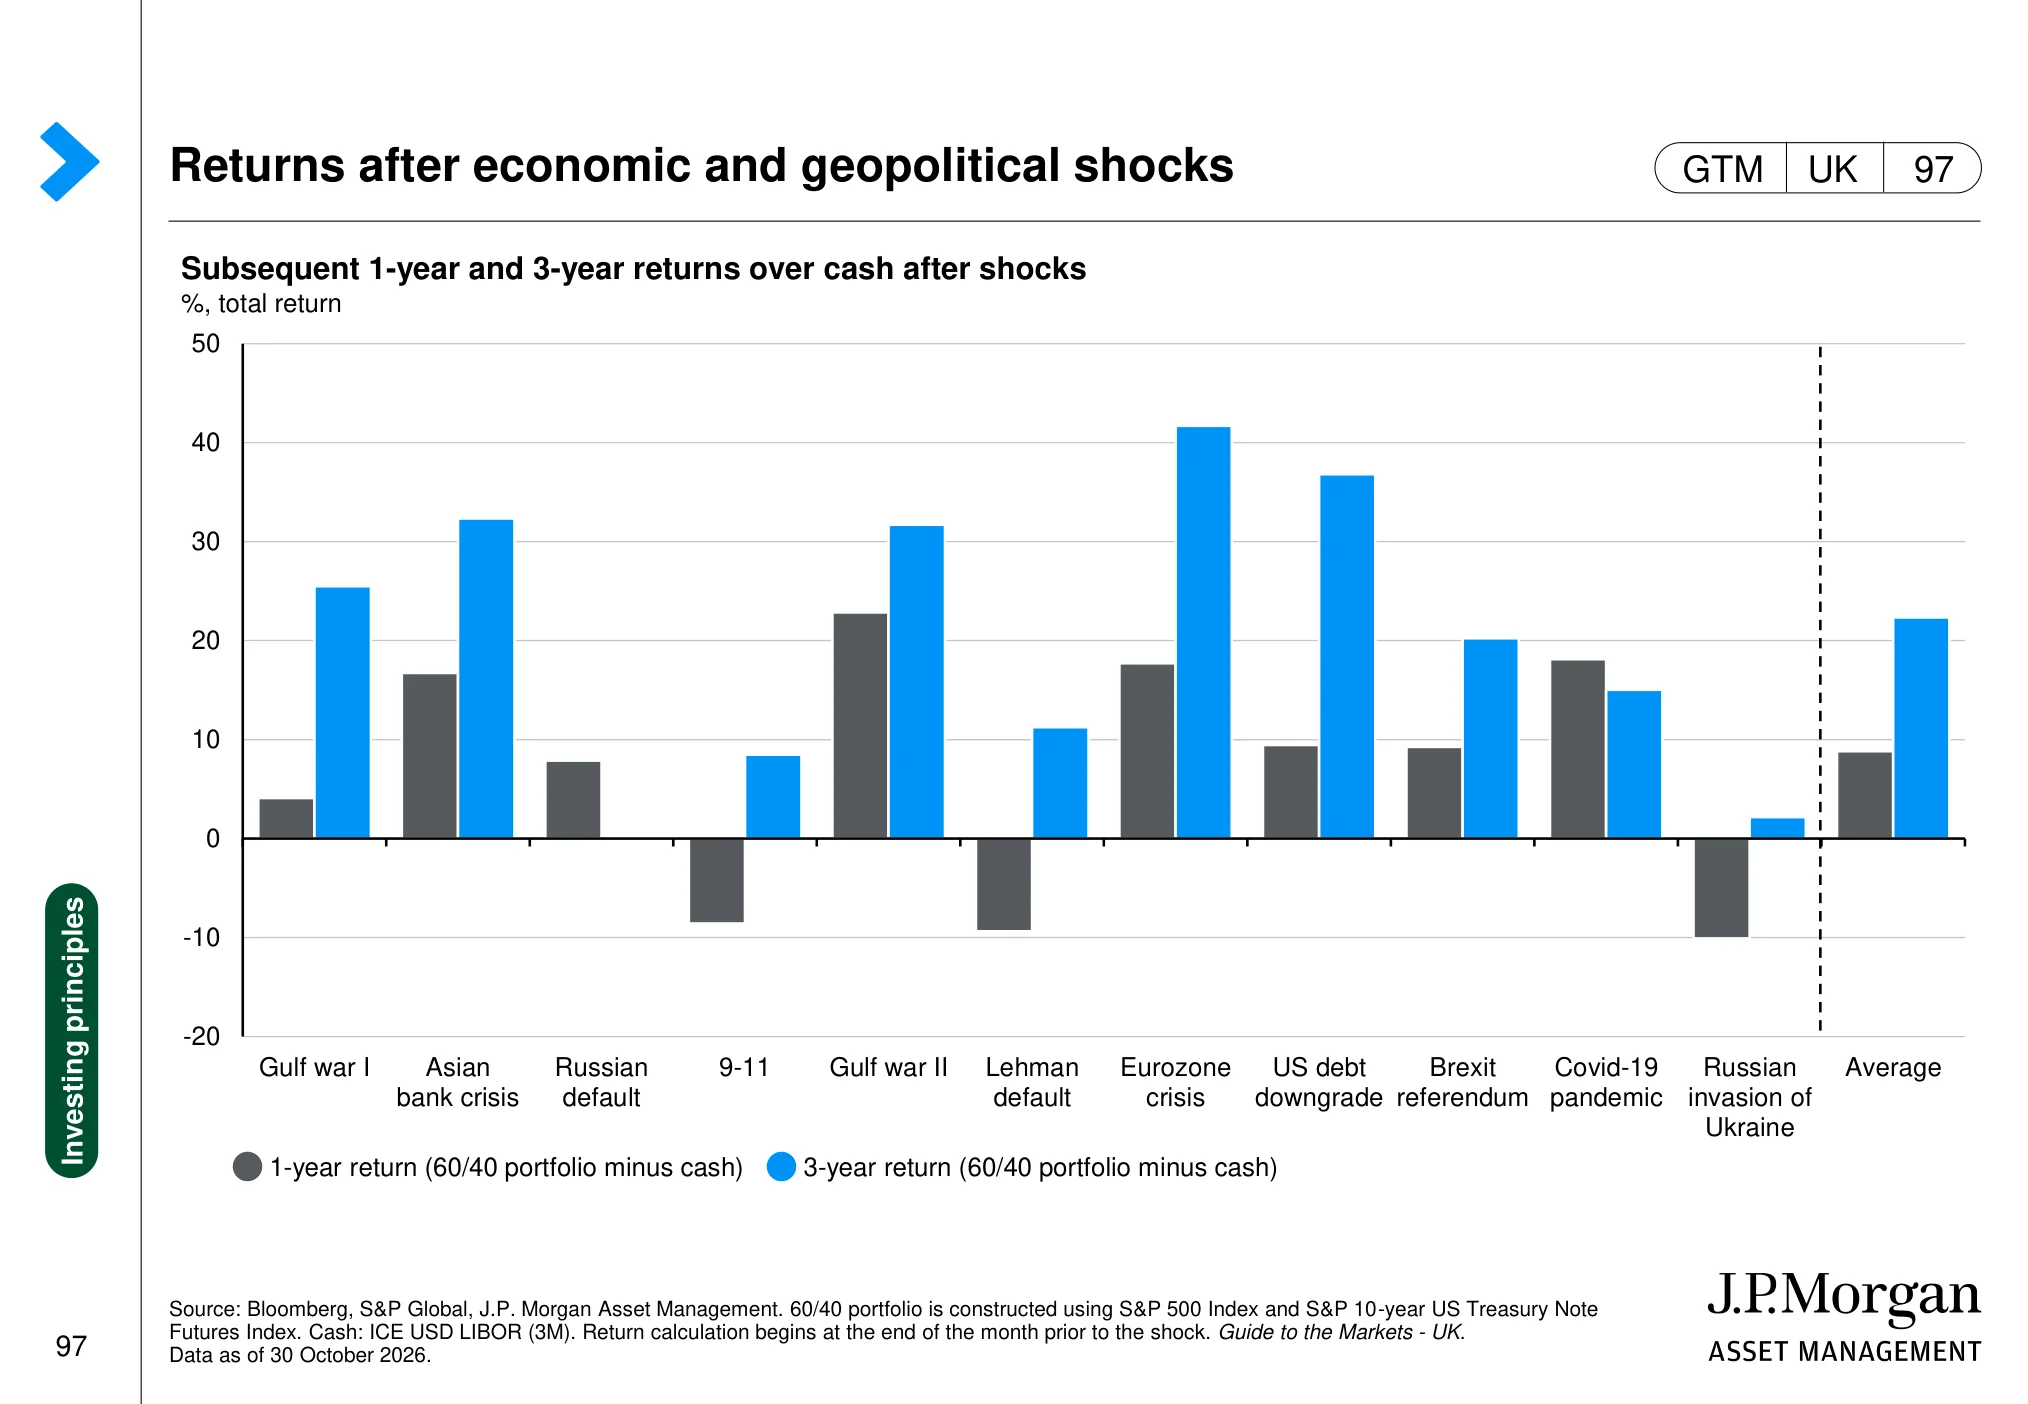
Returns after economic and geopolitical shocks (page 97)
 (opens in a new tab)
The chart: The chart shows returns after selected economic and geopolitical shocks, comparing subsequent one-and three-year outcomes with cash.
Why it matters: Historical recoveries show that markets have often rewarded patience after shocks, although outcomes vary and are never guaranteed.
US asset returns by holding period (page 98)
 (opens in a new tab)
The chart: The page compares the range of US equity and bond returns over rolling one-, five-, ten-and twenty-year holding periods.
Why it matters: Longer holding periods have historically narrowed the range of outcomes, reinforcing the importance of time horizon while not removing risk.
What these charts mean for UK investors
Pulling the 48 slides together, five lessons stand out for anyone investing in UK and US shares.
- Valuation sets the long-run odds, not next month's move. The US is more expensive than its history and the UK is cheaper. Neither fact tells you what happens next quarter, but both shape what you can reasonably expect over ten years.
- Owning "the index" is a concentrated bet. With roughly 40% of the S&P 500 in ten companies, and about a third of global equities in technology, a global tracker is a large position in AI-linked giants. Know that before you buy it.
- Earnings do the heavy lifting. Share prices can rise on optimism for a while. Over time, they follow profits, which is why earnings revisions and margins deserve as much attention as headlines.
- Currency is part of your return. A UK investor in US shares owns the dollar too. A strong pound can erase a good year on Wall Street, and a weak one can flatter it.
- Volatility is the price of admission. A double-digit fall within a year is normal, not a crisis. The investors who do best are usually those who planned for it in advance rather than reacting to it.
Frequently asked questions
What is the J.P. Morgan Guide to the Markets?
It is a chart book produced by J.P. Morgan Asset Management's Market Insights team, refreshed every quarter, covering the economy, equities, fixed income, alternatives and long-term investing principles. It is designed for financial professionals, with a separate UK edition. You can view and download it from the J.P. Morgan Asset Management website (opens in a new tab).
Are US shares overvalued in November 2026?
On 30 October 2026, the S&P 500 traded at 18.5 times forward earnings, above its 16.7x average since 1990 but below the roughly 22x it started 2026 on. The Shiller CAPE ratio was 40.7x against a 27.3x average. Higher valuations have historically pointed to lower long-run returns, but they are a poor guide to short-term direction.
Are UK shares cheap compared with US shares?
On J.P. Morgan's figures, the FTSE All-Share trades at about 12 times forward earnings, below its median since 2000 and well below the US. A discount is not a guarantee of recovery: the UK has a very different sector mix, with about 24% in financials, 15% in consumer staples and 14% in energy but only about 1% in information technology, against about 37% technology in the S&P 500. Its earnings outlook matters as much as its price.
How often do stock markets fall during a year?
Very often. According to J.P. Morgan's chart of MSCI World returns, the average intra-year decline over the last 40 years was 14.6% (median 10.5%), yet calendar-year returns were positive in 29 of those 40 years. Falls of 10% or more within a year are a normal part of investing.
What to do next
- Check your concentration. Look up the top ten holdings of every fund or tracker you own and add up how much of your money sits in the same few companies.
- Compare what you pay with history. For each market you hold, note today's forward P/E against its long-run median, using the regional valuation chart above.
- Decide your currency exposure. Work out what share of your portfolio is in dollars, and whether you are comfortable with that if sterling strengthens.
- Plan for the fall before it happens. Write down how big a drop you would sit through without selling, and test it with the free Portfolio Odds tool (opens in a new tab).
- Keep learning the process. My research notes on corrections and bear markets and on why combining volatile assets smooths returns go deeper on two of the themes above, and the weekly markets dashboard keeps the numbers current. If concentration worries you, read S&P 500 concentration: should the Magnificent Seven worry you?.
Want a second pair of eyes on how your portfolio lines up against these charts? Book your free call with Alpesh's team (opens in a new tab). We will show you how to check valuation, concentration and currency risk in what you already own. There is nothing to buy on the call.
About Alpesh Patel OBE
Alpesh Patel OBE is Founding Principal of Rootbridge Capital, an author and Dealmaker for the UK Government's Department for Business. He is a former Visiting Fellow in Business, Corpus Christi College, Oxford University, where he worked on technology to improve financial education. Watch his free investing education on YouTube (opens in a new tab).
Sources
- J.P. Morgan Asset Management, Guide to the Markets – UK (opens in a new tab), data as of 30 October 2026. All 48 slides above are reproduced unaltered from this publication; each slide's footer lists its underlying data sources.
- J.P. Morgan Asset Management, Guide to the Markets: Q4 2026 key themes (opens in a new tab).
- Alpesh Patel OBE, Is the S&P 500 Due for a Correction? (opens in a new tab), YouTube, 24 September 2026.
J.P. Morgan Asset Management: risks and disclosures
The Market Insights programme provides comprehensive data and commentary on global markets without reference to products. Designed as a tool to help clients understand the markets and support investment decision-making, the programme explores the implications of current economic data and changing market conditions. For the purposes of MiFID II, the JPM Market Insights and Portfolio Insights programmes are marketing communications and are not in scope for any MiFID II / MiFIR requirements specifically related to investment research. Furthermore, the J.P. Morgan Asset Management Market Insights and Portfolio Insights programmes, as non-independent research, have not been prepared in accordance with legal requirements designed to promote the independence of investment research, nor are they subject to any prohibition on dealing ahead of the dissemination of investment research.
This document is a general communication being provided for informational purposes only. It is educational in nature and not designed to be taken as advice or a recommendation for any specific investment product, strategy, plan feature or other purpose in any jurisdiction, nor is it a commitment from J.P. Morgan Asset Management or any of its subsidiaries to participate in any of the transactions mentioned herein. Any examples used are generic, hypothetical and for illustration purposes only. This material does not contain sufficient information to support an investment decision and it should not be relied upon by you in evaluating the merits of investing in any securities or products. In addition, users should make an independent assessment of the legal, regulatory, tax, credit, and accounting implications and determine, together with their own financial professional, if any investment mentioned herein is believed to be appropriate to their personal goals. Investors should ensure that they obtain all available relevant information before making any investment. Any forecasts, figures, opinions or investment techniques and strategies set out are for information purposes only, based on certain assumptions and current market conditions and are subject to change without prior notice. All information presented herein is considered to be accurate at the time of production, but no warranty of accuracy is given and no liability in respect of any error or omission is accepted. It should be noted that investment involves risks, the value of investments and the income from them may fluctuate in accordance with market conditions and taxation agreements and investors may not get back the full amount invested. Both past performance and yields are not a reliable indicator of current and future results. J.P. Morgan Asset Management is the brand for the asset management business of JPMorgan Chase & Co. and its affiliates worldwide. In the United Kingdom, this communication is issued by JPMorgan Asset Management (UK) Limited, which is authorized and regulated by the Financial Conduct Authority. Copyright 2026 JPMorgan Chase & Co. All rights reserved.
The slides are reproduced for education with full credit to J.P. Morgan Asset Management. Alpesh Patel OBE and alpeshpatel.com are not affiliated with or endorsed by J.P. Morgan. The plain-English notes under each slide are Alpesh Patel's own.
Important: This article is for education only and is not personal financial advice or a recommendation to buy or sell any investment. This article is general investment education only and is not regulated investment advice. The value of investments can go down as well as up, and you may get back less than you invest. Past performance is not a reliable indicator of future results.
Important: this article is education and information only. It is not financial advice or a personal recommendation, and it does not take your circumstances into account. The value of investments and pensions can fall as well as rise, and you may get back less than you put in. Past performance is not a reliable indicator of future results. Figures were correct when the article was written and may have changed. If you are unsure what is right for you, speak to a regulated financial adviser.