Blue Wave, Red Screens? What the 2026 Midterm Elections Mean for Your Money
The 2026 midterm elections are over, and Democrats have won both the House and the Senate (opens in a new tab), taking control of Congress for the rest of Donald Trump's presidency. The first reaction on screens was red. Overnight, S&P 500 futures fell as much as 1.4% and Nasdaq-100 futures as much as 2.4% (opens in a new tab), before steadying by the early hours of Wednesday morning.
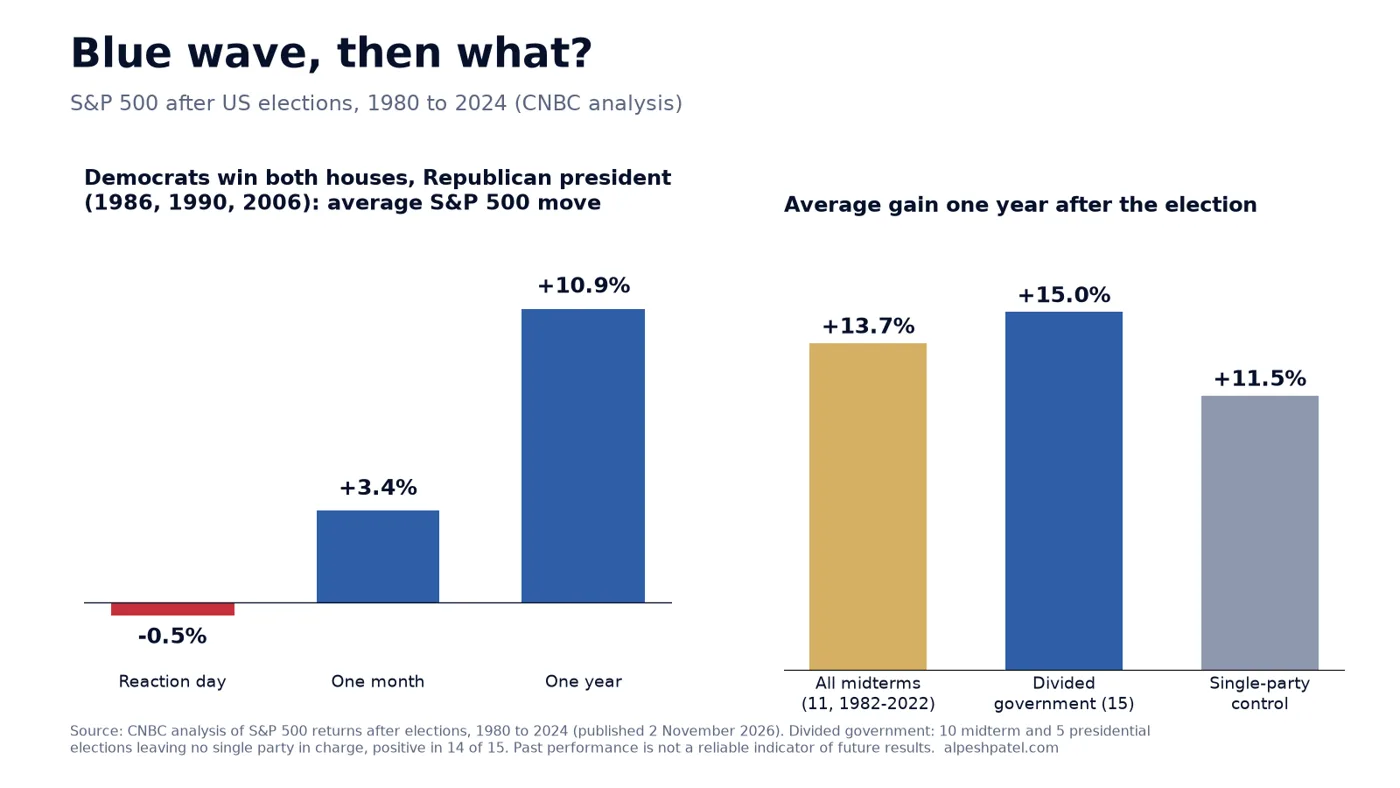
Here is the surprising part. History says this is roughly what tends to happen, and what comes next has usually been rather better. A CNBC analysis of every US election from 1980 to 2024 (opens in a new tab) found that the S&P 500 was higher one year after all 11 midterms from 1982 to 2022, with an average one-year gain of 13.7%. In the three midterms when Democrats took both houses under a Republican president, the index averaged a 0.5% fall on the reaction day and a 10.9% gain a year later.
So should you relax? Not quite. History is one input, and this election landed on a market that was already wobbling. In this post I set out what the result means for stocks, why the AI trade is the real story, what my own momentum readings say right now, and the process I would follow rather than the headlines.
Short answer: The 2026 midterm elections gave Democrats control of Congress, creating divided government. Since 1980, the S&P 500 has averaged a 15% gain in the year after elections that left power divided, and it rose after every midterm from 1982 to 2022. But markets entered this election already falling, led by AI stocks, so process matters more than history.
Unsure what the election means for your own portfolio or pension? Book your free call with Alpesh's team (opens in a new tab). We will show you how to read the market's momentum and build a process that does not depend on who wins elections. There is nothing to buy on the call.
What happened in the 2026 US midterm elections?
Voters went to the polls on Tuesday 3 November 2026 to elect the whole House of Representatives and a third of the Senate. By Wednesday morning, the Associated Press (opens in a new tab) had called both chambers for the Democrats. Coming into the night, Republicans held 53 of the Senate's 100 seats (opens in a new tab), so this was a decisive swing.
The scale of the Senate result surprised many. According to AP's live coverage (opens in a new tab), Democrats won Senate seats in states including Kansas, Iowa, Texas, Ohio, Maine, North Carolina and South Carolina. Kansas has not elected a Democratic senator in nearly a century.
For markets, the result means divided government: a Republican in the White House and Democrats running both houses of Congress. That makes big new tax or spending laws harder to pass. It also gives Democrats the power to run investigations and to slow or block parts of the President's agenda.
How did the stock market react to the midterm results?
The first move was sharp and focused on technology. Reuters reported (opens in a new tab) that investors were weighing the prospect of tougher regulation, higher taxes and more oversight of AI and cryptocurrencies. By 3:13am New York time, S&P 500 futures had recovered to show a 0.15% gain.
Asia took the bigger hit. CNBC reported (opens in a new tab) that Japan's Nikkei 225 fell as much as 4.45% to its lowest level since May, led by technology shares. SoftBank Group dropped more than 8%, Tokyo Electron fell 7.04% and SK Hynix lost 5.08%, all on worries about curbs to AI infrastructure.
Not everything fell. Solar and renewable energy shares rose on hopes that a Democratic Congress would halt policies aimed at the industry. CNBC noted that the Invesco Solar ETF rose 3% in Tuesday's regular session, and that options trading in the fund ran at 40 times its usual volume.
It is worth remembering where we started. On Tuesday, before the results, the S&P 500 closed 0.36% higher at 7,568.92 (opens in a new tab). Election-night moves in futures often look dramatic and then fade by the time the cash market opens.
Why the AI trade is the real election story
The most interesting reason for the sell-off was not taxes. It was data centres. According to Wells Fargo estimates cited by CNBC (opens in a new tab), Texas accounts for about 27% of US data centre capacity, measured in gigawatts. The AP projected that Democrat Gina Hinojosa would defeat Texas Governor Greg Abbott, and she had called for an immediate moratorium on new data centres in the state.
That matters because the AI building boom has been one of the biggest drivers of US share prices. Aidan Yao of the Amundi Investment Institute told Reuters (opens in a new tab) that "the significance of these midterm elections is more like a referendum on AI than a referendum on Trump." He added that if AI faces restrictions, US growth, inflation and interest rates all become far harder to predict.
The AI trade was already under pressure before polling day. Reuters noted that the Nasdaq-100 had confirmed a technical correction, a fall of 10% or more from its peak, on Monday 2 November. The election did not start this wobble. It gave it a new reason.
What happens to stocks after midterm elections? The history
This is the question every investor is asking today, so here is the data. The chart below uses CNBC's analysis of S&P 500 returns after every presidential and midterm election from 1980 to 2024.
The key numbers from CNBC's study (opens in a new tab) are:
- The short term is a coin toss. Across all elections, the S&P 500 rose an average of just 0.2% after one day and one week, and 1.1% after one month.
- One year later is usually better. The index averaged a 13.7% gain one year after midterms and was higher after all 11 midterms from 1982 to 2022.
- Markets tend to like gridlock. After 15 elections that left power divided, the S&P 500 rose an average of 15% over the next year, and was positive in 14 of the 15 cases. After single-party control, the average was 11.5%.
- Today's exact set-up has happened three times. After the 1986, 1990 and 2006 midterms, when Democrats won both houses under a Republican president, the index averaged a 0.5% fall on the reaction day, a 3.4% gain after a month and a 10.9% gain after a year.
Charles Schwab's research points the same way. Its chief strategist found that in midterm years since 1974, the S&P 500 averaged a 5.7% return in the three months after a midterm election (opens in a new tab), with positive returns in 11 of the 13 years studied.
Why history is a guide, not a guarantee
Three or eleven or fifteen data points are not many. Each election came with its own economy, interest rates and valuations, and those mattered far more than the vote. In 2006, for example, the market rose for a year after the midterms and then fell into the 2008 financial crisis.
The averages also hide a wide spread of outcomes. A 13.7% average gain can include years of 30% and years of 1%. That is why I never use an election calendar as a reason to buy or sell. I use it as one piece of context, then check what the market itself is telling me.
What is the stock market telling us right now?
This is where my own data comes in. I track a set of measures every week, and you can see the full set on the Markets this week page. Going into the election, they painted a picture of a market that looked calm on the surface but was weaker underneath.
Pullbacks are normal, even in a strong market
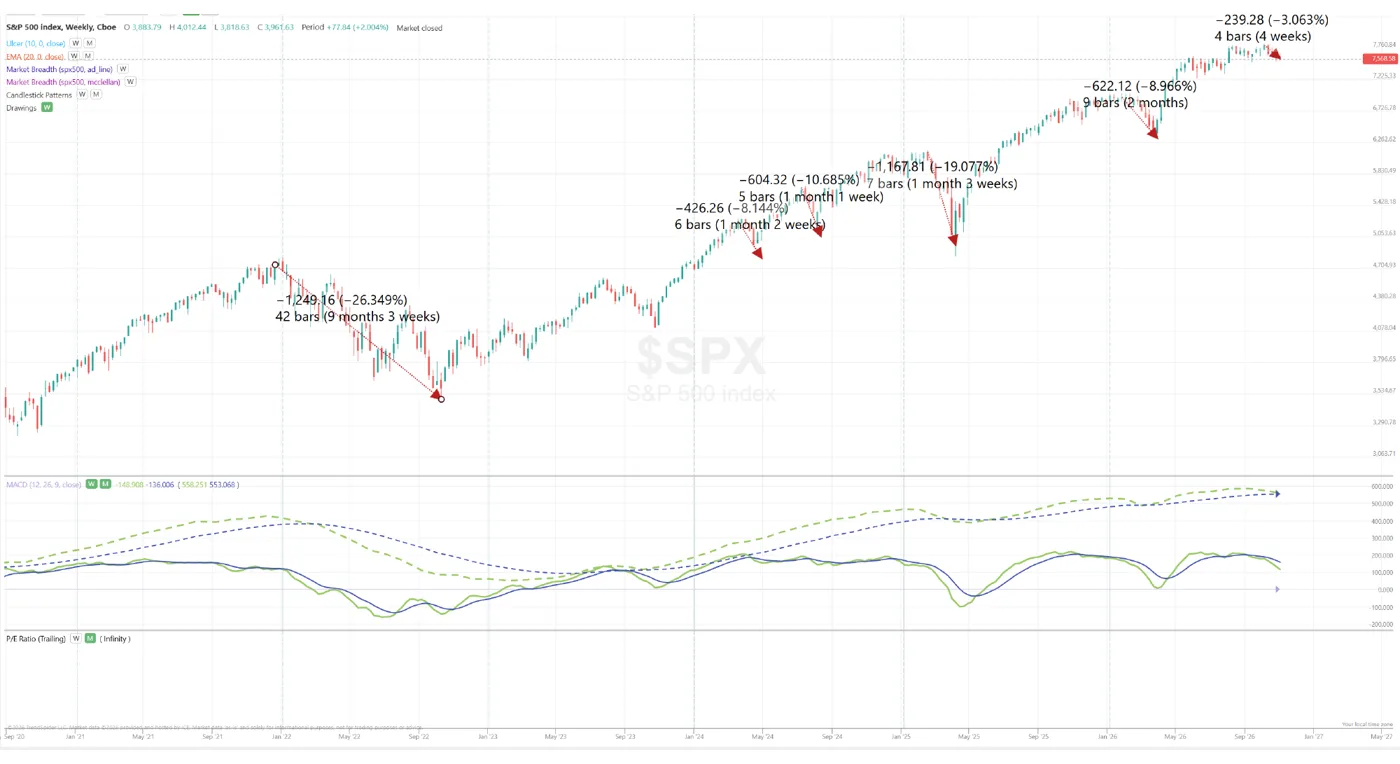
My weekly S&P 500 chart above marks each pullback since 2020. The 2022 bear market took the index down 26.349% over 42 weeks, or 9 months and 3 weeks. Since then there have been falls of 8.144% over 6 weeks, 10.685% over 5 weeks, 19.077% over 7 weeks and 8.966% over 9 weeks. The current pullback is 3.063% over 4 weeks.
Every one of those falls felt important at the time, and every one was followed by new highs. That is the base rate long-term investors need to remember. Research from Dimensional Fund Advisors (opens in a new tab), using Fama/French US market data going back to 1926, shows that average returns after 10%, 20% and 30% declines have been positive over one, three and five years. In the version of that study I use in my research, the average one-year return after a 10% decline was 11.03% and after a 20% decline was 14.21%, against 9.61% a year for all days.
Momentum: the climate and the weather
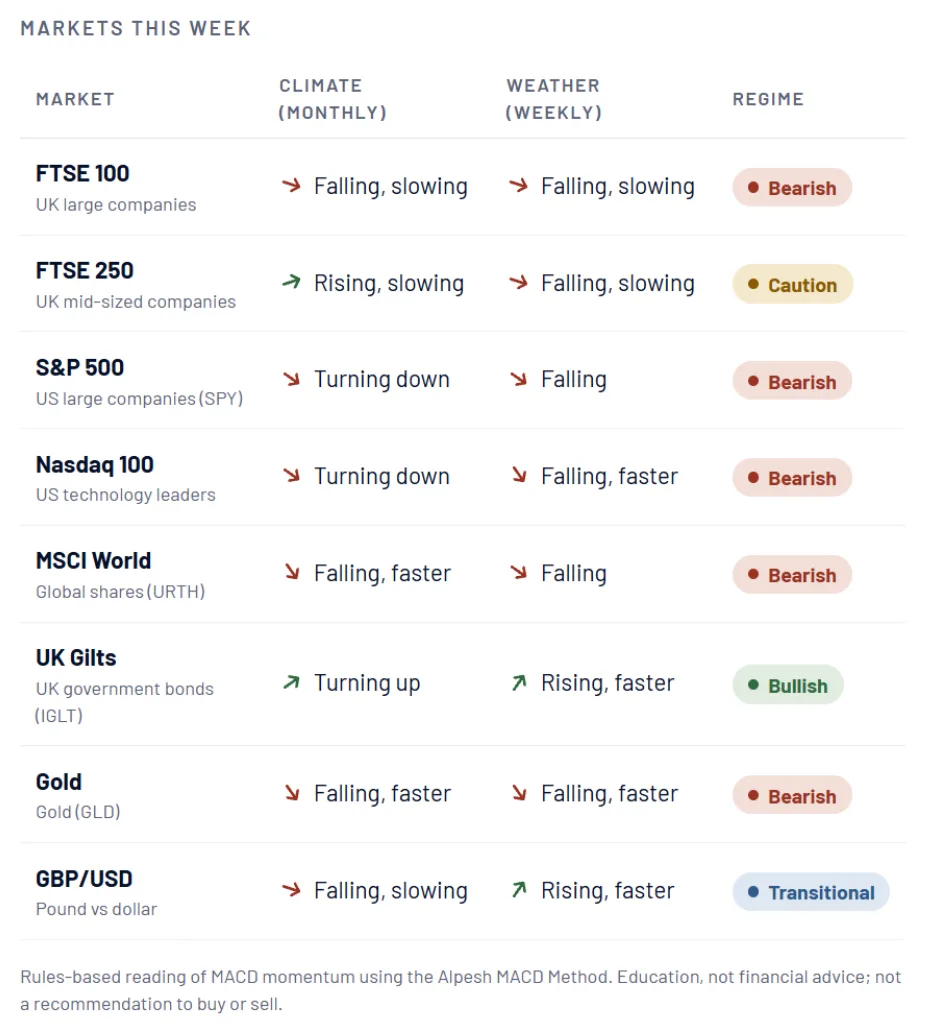
I read momentum with what I call the Alpesh MACD Method. The monthly chart is the climate and the weekly chart is the weather. When they disagree, the climate usually wins, because that is where the big institutional money is positioned.
This week's reading is clear. The S&P 500's monthly climate is turning down and its weekly weather is falling, which puts it in a Bearish regime. The Nasdaq 100 is also Bearish, with its weekly momentum falling faster. The FTSE 100 is Bearish, the FTSE 250 is at Caution, and the one Bullish reading is UK gilts, where momentum is turning up. You can follow the live readings on my Market Regime page.
A Bearish regime does not mean "sell everything". It means two things in my process. First, I do not chase short bursts of strength against a falling monthly trend. Second, any new position is sized smaller than it would be in a rising market, so that a mistake costs less.
Under the surface: breadth and the biggest companies
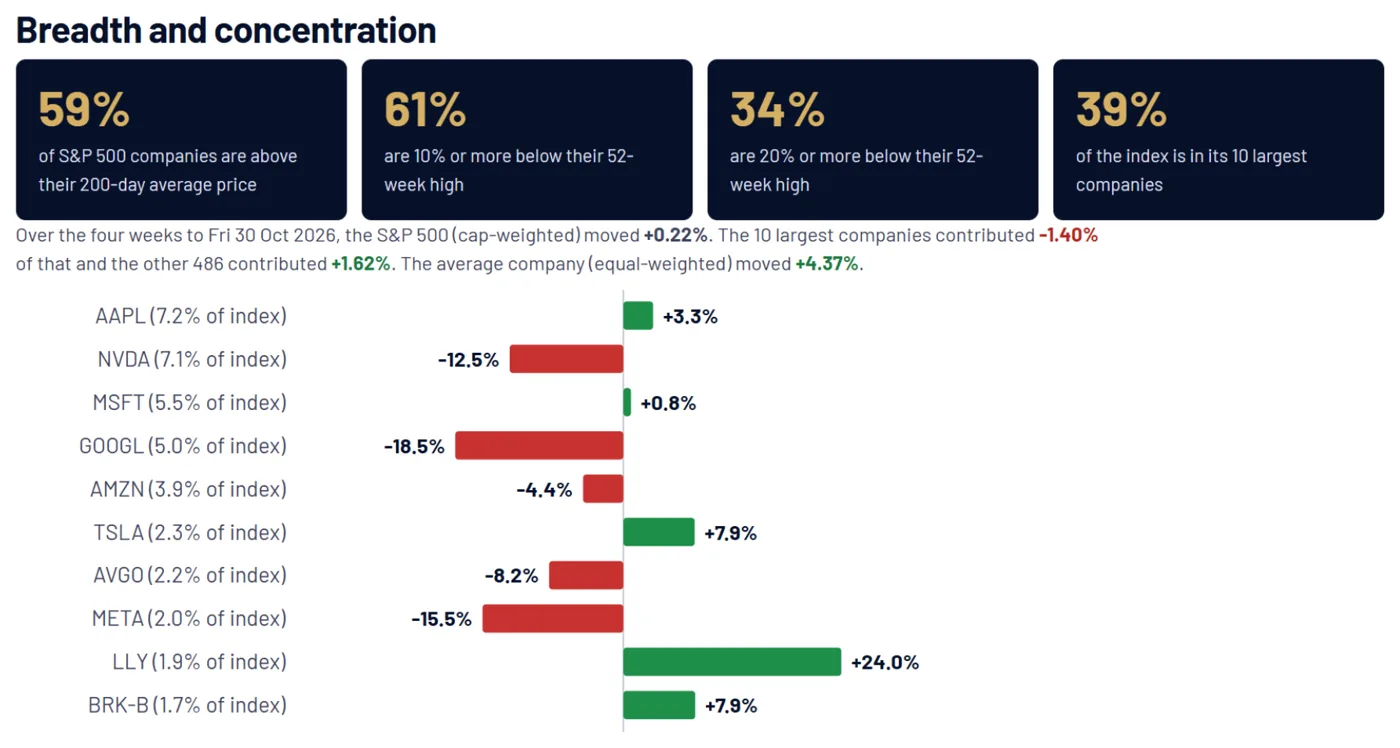
Over the four weeks to Friday 30 October, my data shows the S&P 500 barely moved, up just 0.22%. But that hides two very different markets. The 10 largest companies, which make up 39% of the index, took 1.40% off its return. The other 486 added 1.62%, and the average company, on an equal-weighted basis, rose 4.37%.
Breadth is also more fragile than the headline suggests. Only 59% of S&P 500 companies were above their 200-day average price, 61% were 10% or more below their 52-week high and 34% were 20% or more below it. Communication services fell 14.40% over the four weeks and technology fell 6.59%, while consumer defensive shares rose 12.63% and healthcare 12.01%.
In plain English, money was already rotating out of the AI and big-tech leaders before the election and into steadier sectors. The midterm result added fuel to a move that had already begun. My Market Mood reading, which combines several sentiment measures, stood at 38 out of 100 this week.
November has history on its side, too
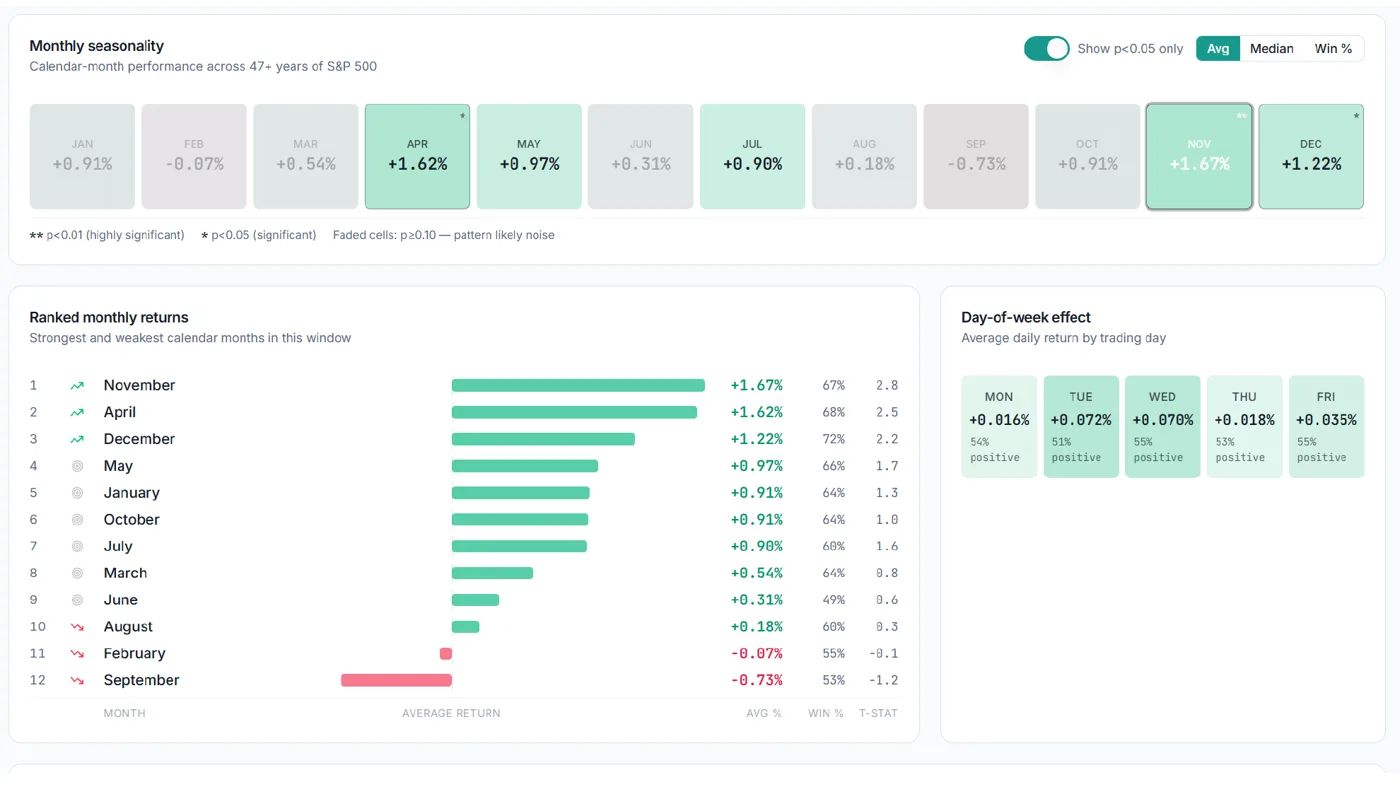
My seasonality data covers more than 47 years of the S&P 500. Over that time, November has been the strongest month of the year, with an average gain of 1.67% and a positive result 67% of the time. It is also the only month where the pattern passes the strictest statistical test in my data (p<0.01). December is third, with an average gain of 1.22%.
Seasonality is a tailwind, not an engine. It will not rescue a market where earnings are disappointing or momentum is falling. But combined with the post-election history, it is one reason not to assume this week's red screens will last.
What does the midterm result mean for UK investors?
If you hold a global tracker, a workplace pension or a SIPP, you almost certainly own a large slice of the US market. That is because US shares are such a big part of global indices, as S&P Dow Jones Indices explains (opens in a new tab). So what happens to the S&P 500 and the big technology companies matters directly to UK savers.
There are three channels to watch. The first is AI and big tech, where the election adds a new layer of regulatory risk to stocks that were already falling. The second is the dollar, because a weaker dollar reduces the value of US holdings for sterling investors. The third is US interest rates, which affect bond prices and mortgage rates around the world.
The UK market itself has held up relatively well. My scoreboard shows the FTSE 100 was 8.04% higher for the year to 30 October and just 2.4% below its 52-week high. That is partly because the UK market holds more banks, energy and defensive companies, and fewer of the technology names now under pressure.
How to invest after the midterm elections: a process, not a prediction
Elections tempt people into big, emotional decisions. Some sell because they dislike the result. Others buy because history says the next year is usually good. Both are making the same mistake: letting a single event replace a process.
Here is how I think about it, in order:
- Start with the climate, not the headline. Check the monthly momentum of the markets you own. Today, the S&P 500 and the Nasdaq 100 are in a Bearish regime, which argues for patience and smaller position sizes, not panic.
- Check concentration. If most of your money is in a global or US tracker, around two-fifths of the S&P 500 is in just 10 companies. Know how much of your portfolio depends on the AI trade.
- Decide your exit and add rules in advance. Write down what would make you add, hold or reduce, before the market forces the decision. My research paper Exit or Hold sets out a framework for exactly this.
- Avoid the reaction-day trap. CNBC's data shows the first day after an election is close to a coin toss. Decisions made in that window are usually driven by fear or excitement, not evidence.
Frequently asked questions
Do stocks go up or down after midterm elections?
Historically, up. A CNBC analysis found the S&P 500 was higher one year after every midterm election from 1982 to 2022, with an average gain of 13.7%. Short-term moves are much less reliable, averaging just 0.2% after one day and one week.
Is divided government good for the stock market?
Since 1980, the S&P 500 has averaged a 15% gain in the year after elections that left power divided, positive in 14 of 15 cases, compared with 11.5% after single-party control. Gridlock tends to mean fewer surprise policy changes, which markets often welcome.
Why did tech stocks fall after the 2026 midterms?
Investors worried that a Democratic Congress, and new Democratic governors in key states such as Texas, could restrict the building of AI data centres. Texas alone accounts for about 27% of US data centre capacity, according to Wells Fargo estimates. The Nasdaq-100 was already in a correction before the vote.
Should I sell my shares because of the election result?
This article cannot give personal advice. History suggests that selling in reaction to an election result has rarely been rewarded. A better approach is to check your portfolio's momentum, concentration and exit rules, and act on a process you set out in advance.
What to do next
- Look at your biggest holdings. Check how much of your pension or ISA is in US technology and AI-linked companies, directly or through trackers.
- Check the regime. Use my free Market Regime and Markets this week pages to see the monthly climate and weekly weather for the markets you own.
- Write down your rules. Decide in advance what would make you add, hold or reduce, and at what position size.
- Ignore the first-day noise. Give the market at least a week before acting on the election, and base any change on your process, not the headline.
- Review your plan with someone who will challenge it. A second view is most valuable when markets are nervous.
Want a clear, rules-based view of your portfolio after the election? Book your free call with Alpesh's team (opens in a new tab). We will walk you through how to read momentum, size positions and set exit rules, so your decisions do not depend on who wins the next vote. There is nothing to buy on the call.
About Alpesh Patel OBE
Alpesh Patel OBE is Founding Principal of Rootbridge Capital, an author and Dealmaker for the UK Government's Department for Business. He is a former Visiting Fellow in Business, Corpus Christi College, Oxford University, where he worked on technology to improve financial education. Watch his free investing education on YouTube (opens in a new tab).
Sources
- Associated Press, Democrats win the US House, taking full control of Congress (opens in a new tab), 4 November 2026.
- Associated Press, Midterm elections live updates (opens in a new tab), 4 November 2026.
- Yahoo News, Midterms 2026 election results and live updates (opens in a new tab), 4 November 2026.
- Reuters, US stock index futures steady as Democrats seize Congress (opens in a new tab), 4 November 2026.
- CNBC, Stock futures fall as Democrats win big in midterms: live updates (opens in a new tab), 3 to 4 November 2026.
- CNBC, Stock market after midterm elections: S&P 500 history (opens in a new tab), 2 November 2026.
- CNBC, Midterm election: how the stock market has performed (opens in a new tab), 29 October 2026.
- SBS News, Wall Street ends mixed amid midterm elections (opens in a new tab), 4 November 2026.
- Dimensional Fund Advisors, Stock gains can add up after big declines (opens in a new tab).
- S&P Dow Jones Indices, Why does the S&P 500 matter to the UK? (opens in a new tab)
- Alpesh Patel OBE, Markets this week and Market Regime, data to 30 October 2026; S&P 500 weekly pullback chart and 47-year seasonality data.
- Alpesh Patel OBE, Should You Buy the Dip? Market Mood Hits 38 out of 100 (opens in a new tab), YouTube, 3 November 2026.
Important: This article is for education only and is not personal financial advice or a recommendation to buy or sell any investment. This article is general investment education only and is not regulated investment advice. The value of investments can go down as well as up, and you may get back less than you invest. Past performance is not a reliable indicator of future results.
Important: this article is education and information only. It is not financial advice or a personal recommendation, and it does not take your circumstances into account. The value of investments and pensions can fall as well as rise, and you may get back less than you put in. Past performance is not a reliable indicator of future results. Figures were correct when the article was written and may have changed. If you are unsure what is right for you, speak to a regulated financial adviser.