AI Panic? What the Data Says After the Worst Day for AI Stocks in 19 Months
On Thursday 5 November 2026, the AI trade had its worst day in a year and a half. The S&P 500 fell 4.4% (opens in a new tab), its biggest drop since the "Liberation Day" tariff shock of April 2025, and the Nasdaq Composite lost 5.5%. Nvidia closed down 9.26%, and AMD fell 17.2%, Micron almost 17.5% and Tesla 10.8% (opens in a new tab). The Nasdaq-100 alone lost USD 2.3 trillion in value (opens in a new tab) in a single session.
Now the part the headlines left out. In that same week, the companies in the S&P 500 were reporting 30.2% earnings growth for the third quarter (opens in a new tab), the third quarter in a row above 25%. And 82% of them beat profit forecasts. Prices fell hard while profits rose fast.
So is this the AI bubble bursting, or a panic you will later wish you had bought? My honest answer is that more falls are likely in the short term, and that the data also shows real grounds for optimism. In this post I set out both sides, with the numbers, and the process I would follow rather than the headlines.
Short answer: The AI stocks sell-off of November 2026 is real, and history suggests further falls in the next few weeks are more likely than not. But S&P 500 earnings are growing about 30% a year, the market's forward valuation is below its 5- and 10-year averages, and after past 4% down days the S&P 500 was higher a year later in 7 of 8 cases. Panic is not a process.
Worried about how much of your portfolio rides on AI? Book your free call with Alpesh's team (opens in a new tab). We will look at your exposure and show you a disciplined process for deciding what to hold, how much, and when to sell. There is nothing to buy on the call.
Why did AI stocks crash this week?
Three things hit at once, and it helps to separate them.
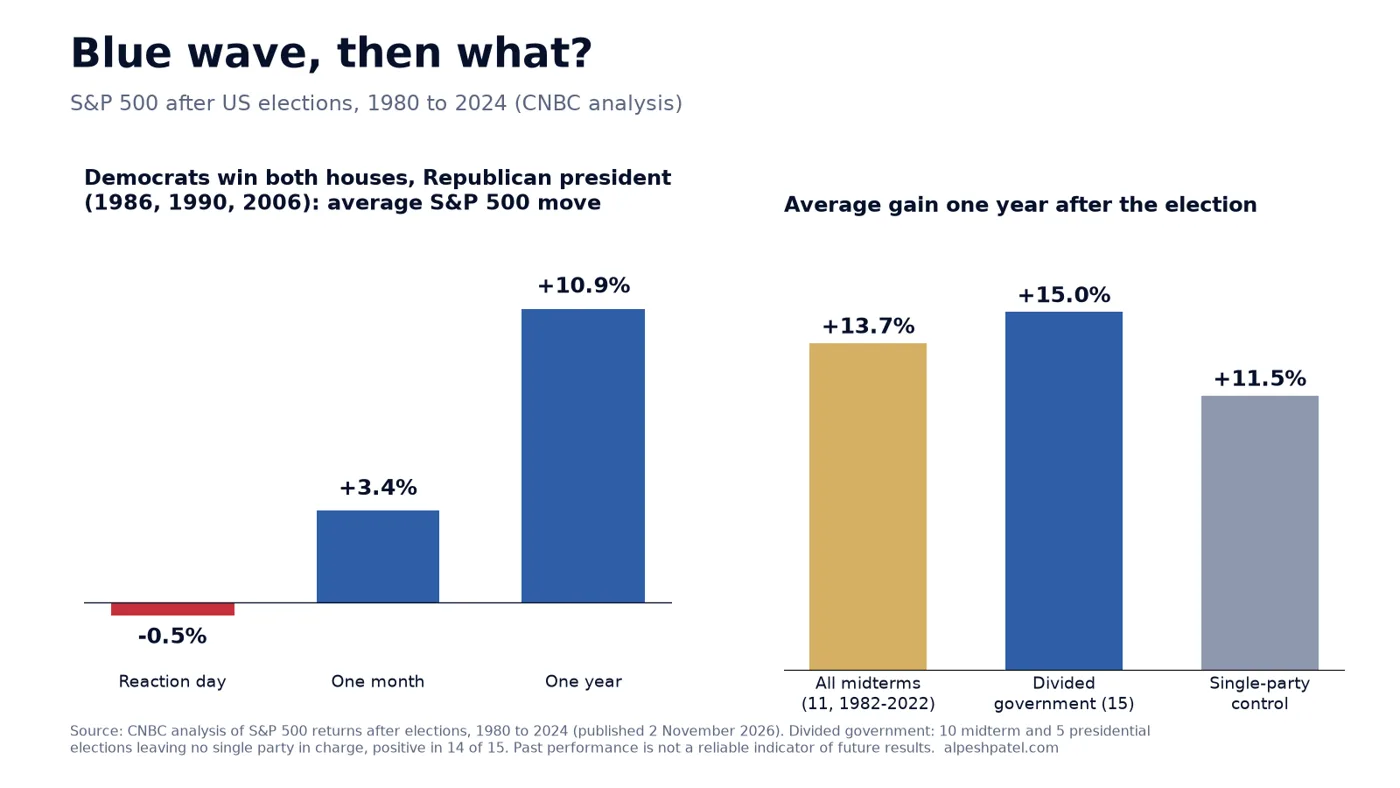
The election. Democrats won control of both houses of Congress on 3 November. Investors are worried about tougher AI regulation and possible moratoriums on new data centres. As AJ Bell's Danni Hewson put it (opens in a new tab), chip stocks suffered as investors weighed the effect on demand of a backlash against data centres and other AI infrastructure. I covered the election in detail in what the 2026 midterm elections mean for your money.
The spending question. The biggest technology companies are on track to spend as much as USD 828 billion on capital expenditure in 2026 (opens in a new tab), and Evercore and Bank of America see AI-related capex reaching USD 1 trillion in 2027. Investors are asking whether all that spending will earn a decent return. Alphabet's third-quarter capex of USD 51 billion pushed its free cash flow negative for a second quarter (opens in a new tab), while Microsoft generated USD 19 billion of free cash flow on similar spending.
Crowding and forced selling. Goldman Sachs analysts said asset managers sold ahead of the election, bought back in after the result, and then some hedge funds cut exposure or banked profits (opens in a new tab), turning it into a near-indiscriminate sell-off. The day before, the market had enjoyed its best day in three months. Thursday wiped that out and more.
The crowding was obvious in advance. Bank of America's October fund manager survey found a net 37% of professional investors were overweight technology, the highest since August 2020 (opens in a new tab). Long global semiconductors was named the most crowded trade. When everyone is on one side of the boat, it does not take much to tip it.
What did the fear look like?
Wall Street's "fear gauge", the VIX, jumped 69.7% to 28.18 (opens in a new tab) on Thursday. The selling spread to Asia too: Japan's Nikkei 225 and South Korea's Kospi both ended 6% lower (opens in a new tab), and TSMC went limit down at the open in Taipei (opens in a new tab) on Friday.
UK investors were not spared, but they felt it far less if they owned the UK market. The FTSE 100 fell just 0.4% to 10,782.66 (opens in a new tab), even on a day when the Bank of England raised rates. The pain was in the technology trusts many ISA and SIPP investors hold: Scottish Mortgage fell 4.8%, Polar Capital Technology 6.6% and Allianz Technology Trust 7.1%.
Is the AI bubble bursting?
Nearly half of fund managers think a bubble is coming. In the same Bank of America survey, 45% said an AI bubble would emerge in 2027 (opens in a new tab), against 42% who disagreed. That is not a comfortable consensus.
I have seen this film before. I was on the Bloomberg desk through the dot-com boom, watching the day-trader craze build. The FT summed up its end well: never in the history of wealth hunting have so many lost so much, so quickly. Manias repeat. So I take bubble fears seriously.
But a bubble needs prices racing ahead of profits. Right now, profits are racing ahead of prices. That is the key difference from 2000, and it is where the data starts to look more positive.
Not every AI stock has fallen equally
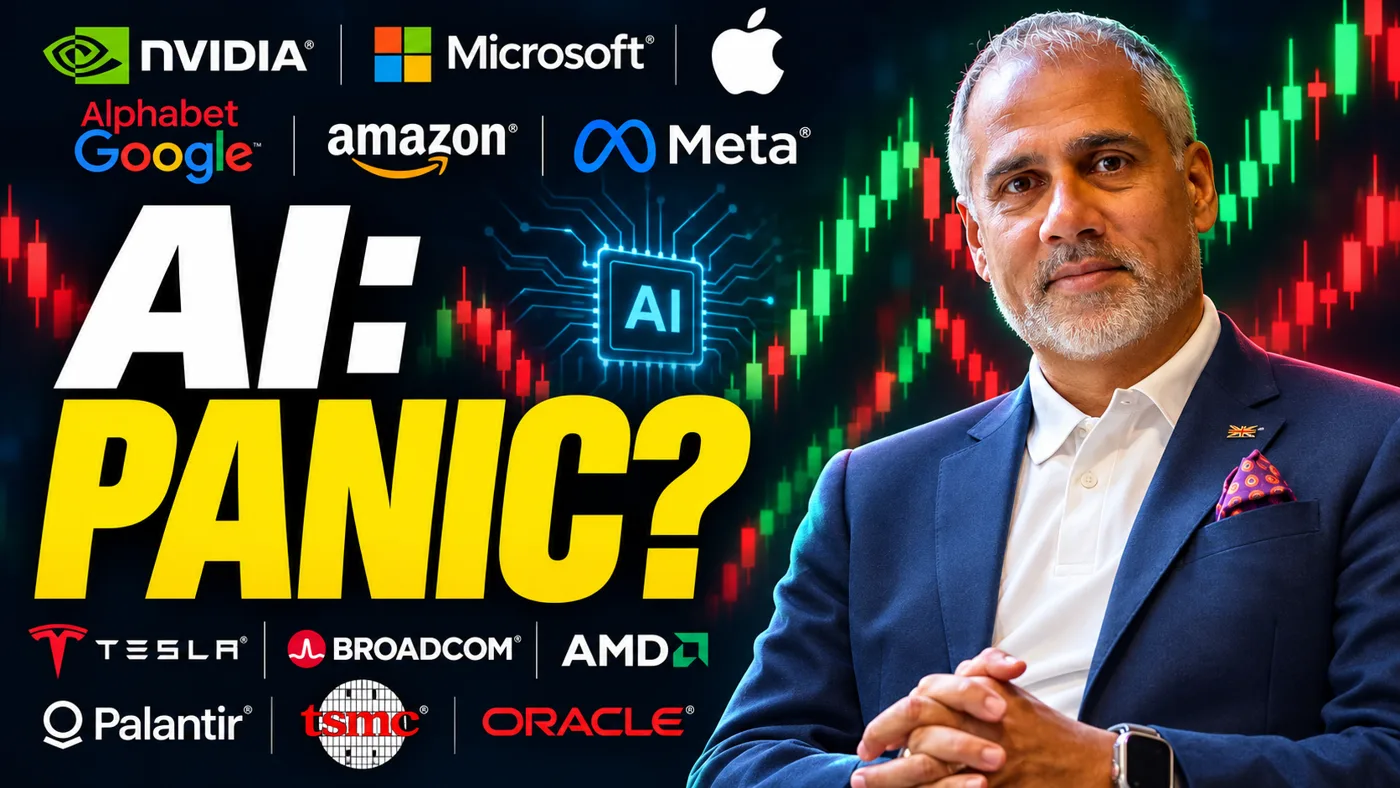
Most commentary lumps all the "AI giants" together. The chart below shows how far each of the 12 companies in my latest video's thumbnail had fallen from its 2026 closing high by the close on 5 November.
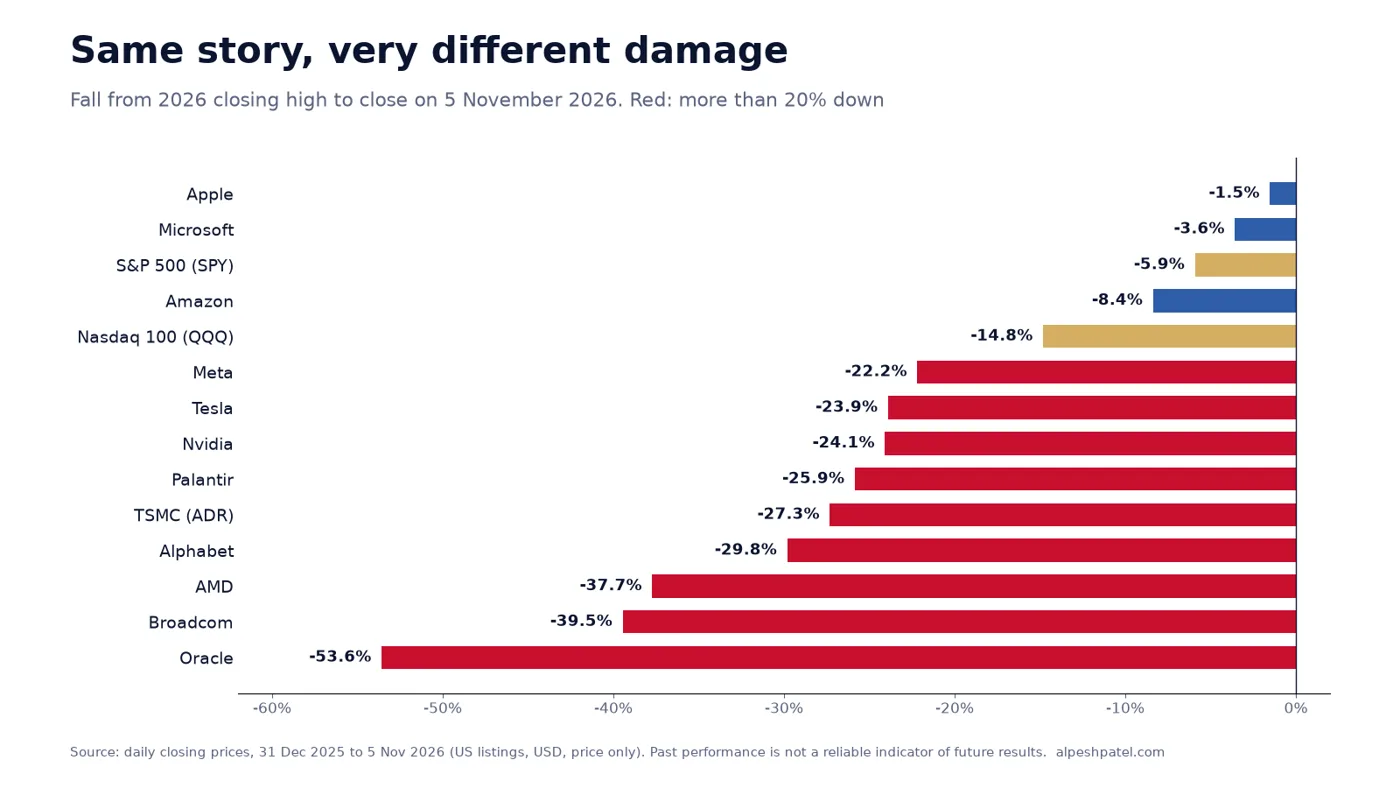
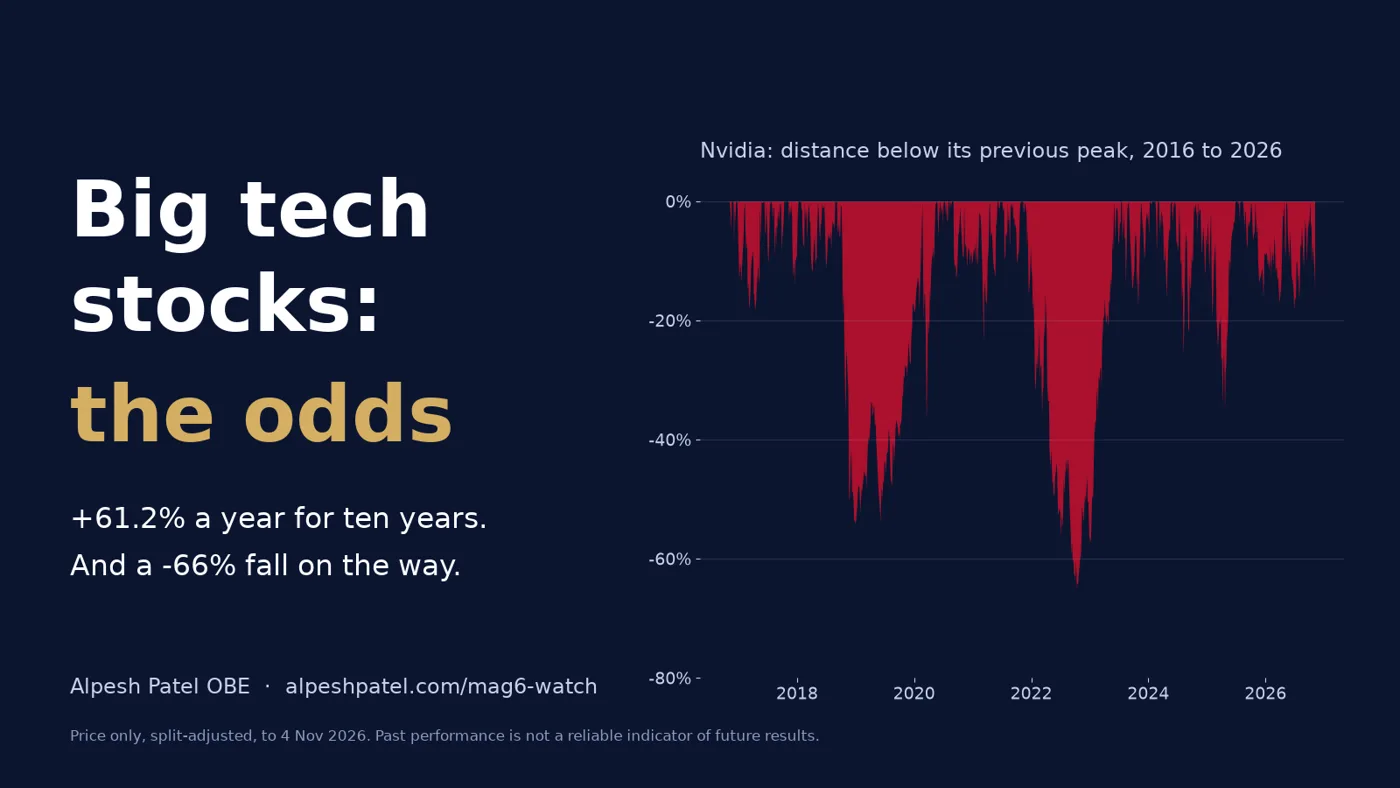
The spread is enormous. Apple closed only 1.5% below its 2026 high, and Microsoft 3.6%. At the other end, Oracle was 53.6% down, Broadcom 39.5% and AMD 37.7%. The S&P 500 itself, measured by the SPY ETF, was just 5.9% off its high.
| Company | Fall on 5 Nov 2026 | Change in 2026 to date | Below 2026 closing high |
|---|---|---|---|
| Apple | -1.5% | +26.6% | -1.5% |
| Microsoft | -3.6% | +10.8% | -3.6% |
| Amazon | -2.2% | +12.7% | -8.4% |
| Meta | -4.0% | -8.3% | -22.2% |
| Tesla | -10.8% | -23.6% | -23.9% |
| Nvidia | -9.3% | -2.6% | -24.1% |
| Palantir | -9.7% | -12.8% | -25.9% |
| TSMC (US ADR) | -10.8% | +16.2% | -27.3% |
| Alphabet | -2.2% | -9.7% | -29.8% |
| AMD | -17.3% | +88.8% | -37.7% |
| Broadcom | -10.4% | -15.8% | -39.5% |
| Oracle | -6.9% | -40.9% | -53.6% |
| S&P 500 (SPY) | -4.4% | +7.5% | -5.9% |
| Nasdaq 100 (QQQ) | -6.5% | +5.3% | -14.8% |
Source: daily closing prices in US dollars, 31 December 2025 to 5 November 2026, price only. Past performance is not a reliable indicator of future results.
The lesson is simple. "AI" is not one investment. A company that makes money from AI today and a company that is borrowing heavily to build for AI tomorrow are very different risks. If you hold both through an index or a tech trust, you may own more of the second kind than you realise. My Mag6 Watch dashboard tracks the risk and return history of the biggest names, and my earlier post asks whether Magnificent Seven concentration should worry you.
What the data says: three reasons for optimism
Here is the positive side, kept to the three numbers that matter most.
1. Profits are growing fast, and not just at the giants
FactSet's latest figures show S&P 500 earnings growth of 30.2% for the third quarter of 2026 (opens in a new tab), with revenue up 13.4%. Analysts expect 32.9% earnings growth for the whole of 2026 and 16.3% for 2027.
The surprise is where that growth is coming from. The "Magnificent 7" reported 22.6% earnings growth in the third quarter, while the other 493 companies reported 32.6% (opens in a new tab). If that holds, it will be the first time since the fourth quarter of 2022 that the giants grew more slowly than the rest. Analysts expect the same pattern in the fourth quarter: 22.6% against 30.8%.
That matters for the bubble debate. The market is not resting on seven companies' profits alone. And analysts are raising, not cutting, their forecasts: the fourth-quarter earnings estimate rose 1.4% in October (opens in a new tab), when over the past five years it has typically fallen 1.1% in the first month of a quarter.
2. The market is cheaper than its averages
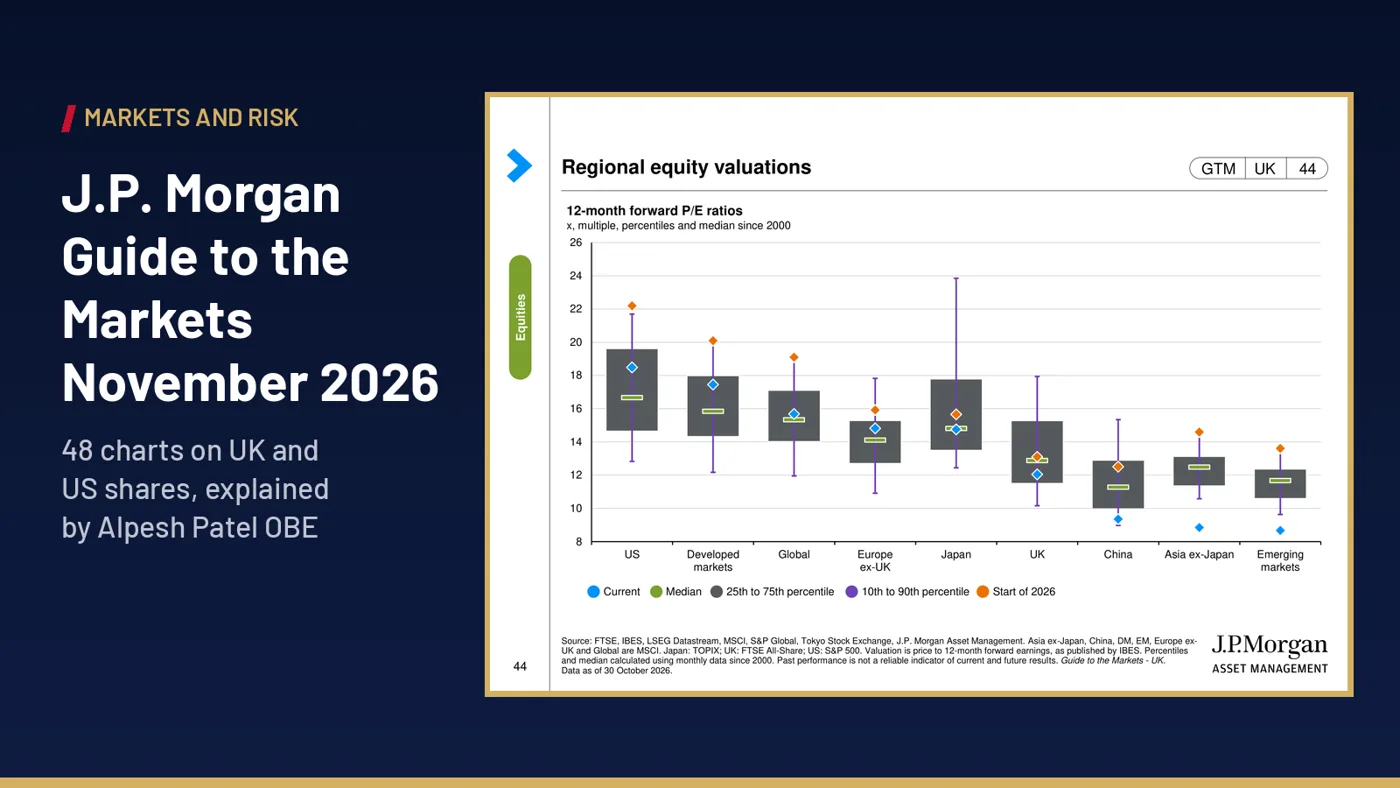
Before Thursday's fall, the S&P 500 traded on a forward price-to-earnings ratio of 18.7 (opens in a new tab). That is below its 5-year average of 19.8 and its 10-year average of 19.1. MarketWatch noted the multiple had dropped nearly 17% since the start of 2026 (opens in a new tab), because profits rose while prices went sideways for five months.
After a 4.4% fall, the market is cheaper still. Ameriprise's Anthony Saglimbene gave the sensible caveat: the ratio is healthy, but "it doesn't mean that we can't go lower". Valuation tells you about the next five years, not the next five weeks.
3. History: pain first, then recovery
This is the chart I think every worried investor should see. I took every day since December 2006 on which the S&P 500 fell 4% or more, and kept only the first such day in each sell-off. That leaves eight episodes before this one: the 2008 financial crisis, the 2011 US debt downgrade, the 2015 China scare, the 2018 volatility spike, the 2020 pandemic, two in the 2022 bear market and the April 2025 tariff shock.
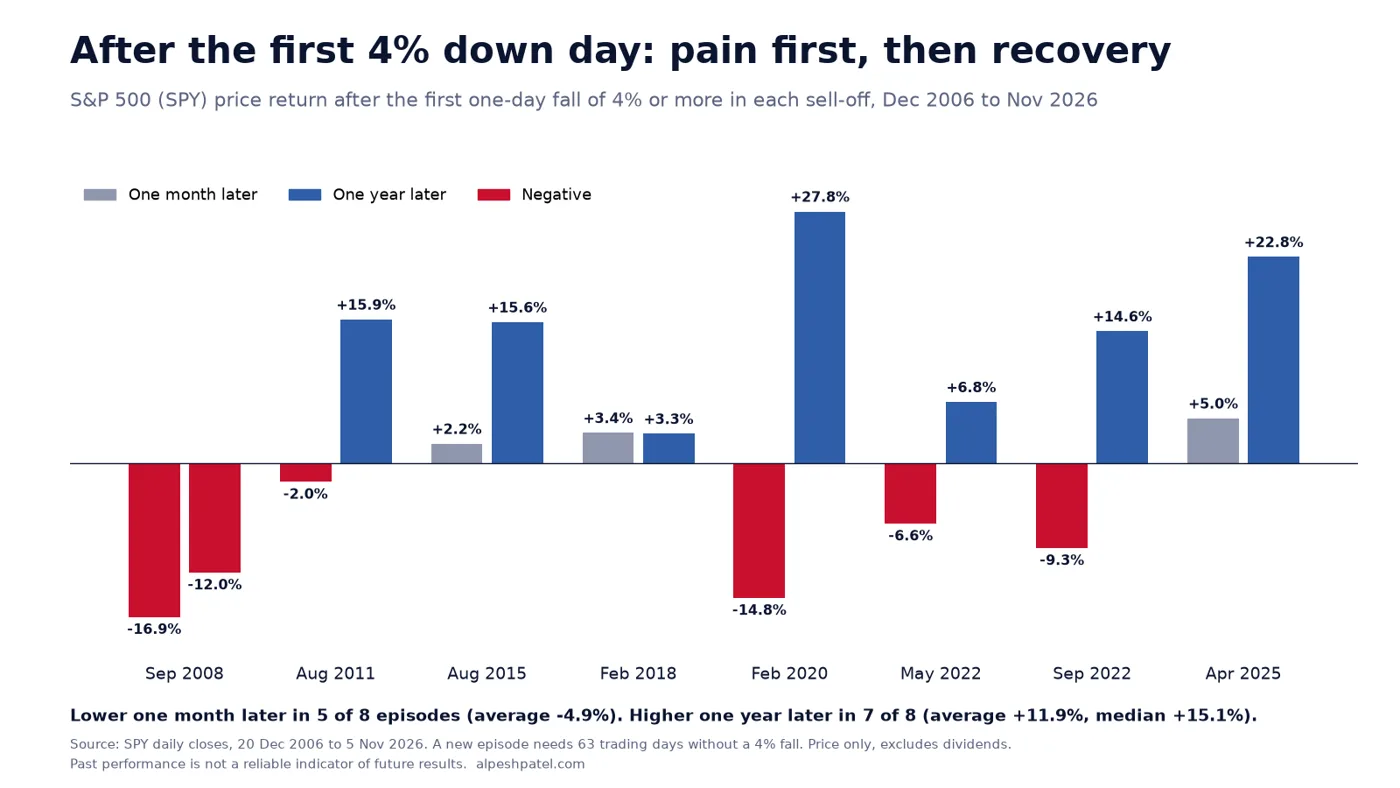
The pattern cuts both ways, and that is why it is useful.
- The next month was usually worse. The S&P 500 was lower one month later in 5 of the 8 episodes, by an average of 4.9%. A 4% down day is often the start of the trouble, not the end.
- The next year was usually better. It was higher one year later in 7 of the 8 episodes, with an average gain of 11.9% and a median of 15.1%.
- The exception was severe. In September 2008 the market was still 12.0% lower a year on. A 4% fall during a genuine economic crisis is different from one during a profits boom.
These are price returns only, before dividends, and eight episodes are not many. But they match much bigger studies. Dimensional's research (opens in a new tab), using US market data from 1926 to 2022, found that average returns after declines of 10%, 20% and 30% were positive over one, three and five years. Goldman Sachs made the same point this week, warning that selling may continue (opens in a new tab) and stocks could trade well below fair value, but that rebounds can be strong once the pressure eases.
Watch the video: don't buy AI stocks until you see this chart
In this week's market update on YouTube (opens in a new tab), I look at S&P 500 returns after major political events, valuations by sector, and how to judge your own exposure to the AI story.
Why more falls are likely, and what could go wrong
I would not be doing my job if I only gave you the good news. There are real reasons the next few weeks could be rough.
- Rates are rising in the UK. On 5 November the Bank of England raised Bank Rate to 4% (opens in a new tab), its first increase in over three years, and warned at least one more rise was likely (opens in a new tab) if the US-Iran conflict continues. Fund managers already rank a disorderly rise in bond yields as their biggest tail risk, ahead of an AI bubble.
- Cash levels are low. Fund managers held only 3.9% in cash (opens in a new tab) in October, below Bank of America's 4% contrarian sell signal. Low cash means there is less money on the sidelines to buy the dip.
- The big test is still to come. Nvidia reports its quarterly results on 17 November (opens in a new tab). After a 24% fall from its October high, the market will be listening closely to what it says about data centre demand.
- Spending without returns. If AI investment keeps rising while free cash flow falls, as it has at Alphabet, the market may keep marking down the heaviest spenders.
The honest summary: this could easily get worse before it gets better. That is exactly why your response should be a process, not a prediction.
How I would respond: a process, not a panic
My video description makes the point I want to finish on. Panic is easy. So is insisting that everything will be fine. Neither amounts to an investment process.
Here is the process I use when markets fall like this.
Check your real exposure
Most investors do not know how much of their money rides on AI. A global tracker, an S&P 500 fund, a technology trust and a few favourite shares can all hold the same names. Add them up. If one story drives more of your portfolio than you would be comfortable losing a third of, that is a sizing problem, not a market problem.
Separate the businesses from the story
For each holding, ask three questions. Is it growing profits now? Is it generating cash, or borrowing to spend? And does the price you pay leave room for the business to disappoint? A company can help change the world and still prove an expensive investment.
When I was a barrister, I learned to cross-examine my own case. I still do it with shares, in three columns: why I like it, the challenges to that view, and my replies. If the replies have become weaker since you bought, that is a reason to act. A falling price on its own is not.
Let momentum, not headlines, guide timing
I read momentum on monthly and weekly charts, with the monthly trend taking priority. A sharp daily fall inside a rising monthly trend is a very different thing from a monthly trend that has rolled over. You can follow the broader picture on my Markets this week page and the weekly Market Regime view.
Decide your sell rules before you need them
The worst time to decide when to sell is during a 9% one-day fall. Set your rules in calm conditions: the loss you will accept on a position, and the signal that tells you a trend has changed. I explain why large swings make people panic, and how to plan for them, in what 20% volatility really means.
What to do next
- List every fund and share you own and estimate your AI exposure. Include index funds and investment trusts, not just individual shares.
- Write down your sell rules for each position before the next big down day, not during it.
- Check your time horizon. If you need the money within a year or two, the short-term risk shown in the chart matters more than the long-term recovery.
- Look at the monthly trend before acting on a daily move. One bad day does not change a long-term trend on its own.
- Get a second pair of eyes. A free call can help you see whether your portfolio is built to survive a sell-off like this. Browse my free investing guides too.
Don't let one bad day make your decisions. Book your free call with Alpesh's team (opens in a new tab) to talk through your portfolio and build a disciplined process for buying, sizing and selling. There is nothing to buy on the call.
Frequently asked questions
Should I sell my AI stocks after the crash?
Not because of one day's fall. Check whether the reasons you bought still hold, how much of your portfolio depends on AI, and whether the long-term trend has changed. Selling in a panic often locks in losses just before a recovery, but holding without a plan is not a strategy either.
Is the AI bubble bursting in 2026?
Nobody can know for certain. 45% of fund managers expect an AI bubble in 2027, but S&P 500 earnings grew 30.2% in the third quarter and the market's forward valuation is below its 5- and 10-year averages. A bubble usually means prices far ahead of profits, which is not what the current figures show.
How long do stock market sell-offs usually last?
It varies. In the eight sell-offs since 2006 that began with a 4% down day, the S&P 500 was lower a month later in five, but higher a year later in seven. Only the 2008 financial crisis left it lower after a year.
How does the AI sell-off affect UK investors?
The FTSE 100 fell only 0.4% on 5 November, because it holds few technology companies. UK investors feel it through global trackers, US funds and technology trusts in their ISAs and SIPPs, such as Scottish Mortgage, which fell 4.8% that day.
About Alpesh Patel OBE
Alpesh Patel OBE is Founding Principal of Rootbridge Capital, an author and Dealmaker for the UK Government's Department for Business. He is a former Visiting Fellow in Business, Corpus Christi College, Oxford University, where he worked on technology to improve financial education.
Sources
- Chicago Tribune / Associated Press, A brutal sell-off for AI stocks sends Wall Street reeling (opens in a new tab), 5 November 2026
- Yahoo Finance UK / The Independent, AI firms hit in worst stock market crash for 18 months (opens in a new tab), 6 November 2026
- LGT, AI oversight fears rattle global stocks (opens in a new tab), 6 November 2026
- Yahoo Finance / Reuters, Morning Bid: AI's reality check (opens in a new tab), 6 November 2026
- Yahoo Finance, Stock Market Today, Nov. 5: Nvidia slides (opens in a new tab), 5 November 2026
- AJ Bell, Late market roundup: FTSE retreats as hawkish BoE, US tech rout weigh (opens in a new tab), 5 November 2026
- FactSet, Earnings Insight (opens in a new tab), 30 October 2026
- FactSet, "Mag 7" now reporting lower earnings growth than the other 493 S&P 500 companies for Q3 (opens in a new tab), 3 November 2026
- FactSet, Analysts increasing quarterly EPS estimates for S&P 500 for 3rd straight quarter (opens in a new tab), 4 November 2026
- MarketWatch via Morningstar, The stock market has gone nowhere for the past 5 months. It's now looking like a bargain (opens in a new tab), 2 November 2026
- Fortune, Fears over USD 828 billion AI capex spending spree (opens in a new tab), 31 October 2026
- Yahoo Finance, Alphabet sinks 11% as AI spending pushes cash flow negative again (opens in a new tab), 29 October 2026
- The Wealth Advisor, Fund managers are more exposed to tech than at any time since 2020 (opens in a new tab) (Bank of America Global Fund Manager Survey, October 2026)
- Bank of England, Bank Rate increased to 4%: November 2026 Monetary Policy Summary (opens in a new tab), 5 November 2026
- Reuters, Bank of England raises rates for first time since 2023, says more may come (opens in a new tab), 5 November 2026
- Dimensional Fund Advisors, Stock gains can add up after big declines (opens in a new tab)
- Price data for the table and charts: daily closing prices for the listed US shares and ETFs (SPY from 20 December 2006, others from 29 December 2025, to 5 November 2026), price only, excluding dividends.
Important: This article is for education only and is not personal financial advice or a recommendation to buy or sell any investment. This article is general investment education only and is not regulated investment advice. The value of investments can go down as well as up, and you may get back less than you invest. Past performance is not a reliable indicator of future results.
Important: this article is education and information only. It is not financial advice or a personal recommendation, and it does not take your circumstances into account. The value of investments and pensions can fall as well as rise, and you may get back less than you put in. Past performance is not a reliable indicator of future results. Figures were correct when the article was written and may have changed. If you are unsure what is right for you, speak to a regulated financial adviser.