Big Tech Stocks: What 10 Years of Data Say About the Odds of Holding Them
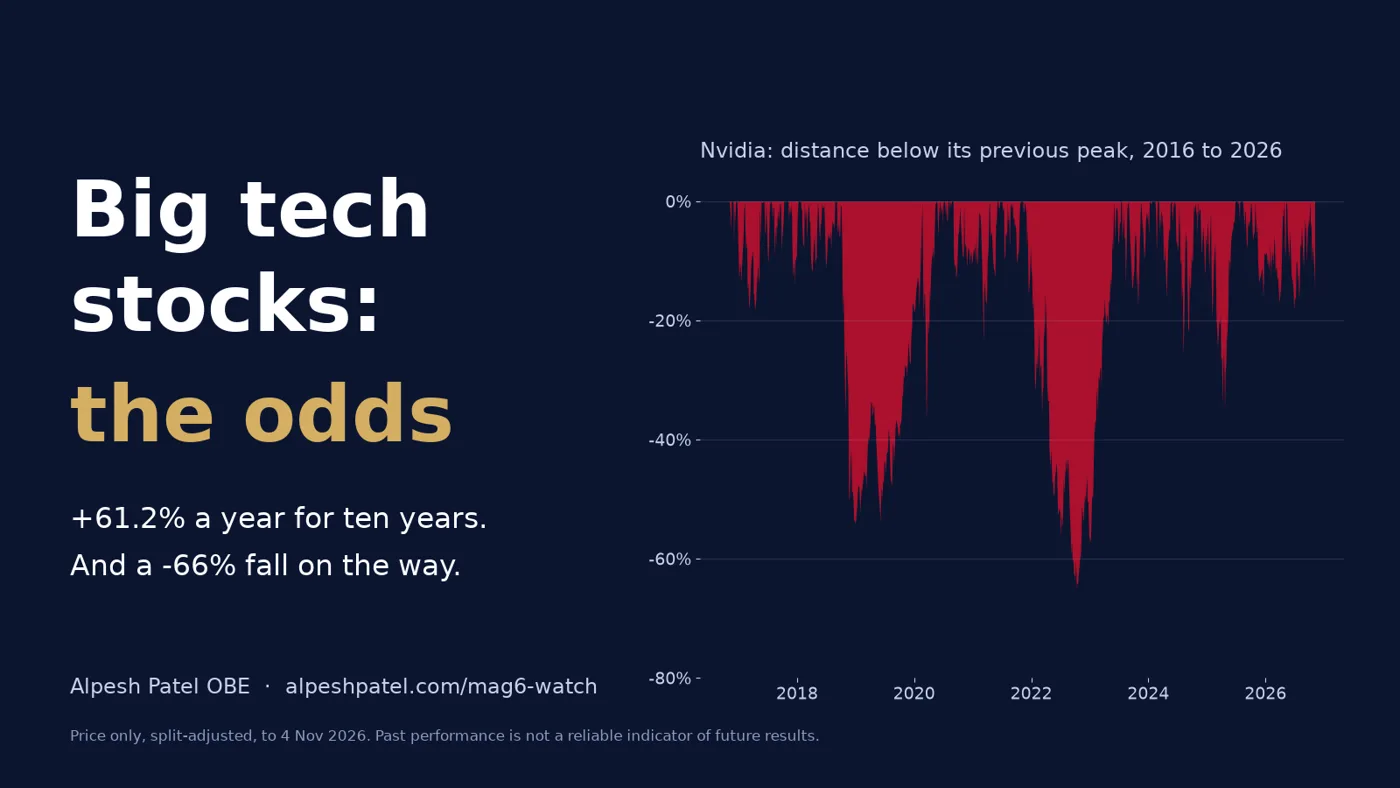
Imagine you put USD 10,000 into Nvidia in November 2016. Five years later, at the late-2021 peak, it was worth close to USD 200,000. Eleven months after that, in October 2022, it was worth less than USD 70,000. Today, on the closing price of 4 November 2026, it is worth about USD 1.18 million.
That is the best-performing big tech stock of the decade: +61.2% a year for ten years, with a 66% fall in the middle. Most people who owned it in 2022 did not own it by 2026. The return was there. Few investors could sit through the ride.
This post uses ten years of daily prices from my free Mag6 Watch dashboard, which tracks Meta, Microsoft, Apple, Amazon, Alphabet and Nvidia (the "Magnificent Seven" without Tesla) against the S&P 500 and the Nasdaq 100. It answers three questions: how often holding these shares paid off, what it cost in pain, and where each one stands right now against its own history.
Short answer: Over the ten years to 4 November 2026, big tech stocks held for about a year ended higher in 71% to 87% of periods, depending on the company, against 85% for the S&P 500. Their typical one-year gains were larger, but so were their falls: from 38% for Microsoft to 77% for Meta, against 34% for the S&P 500. The odds favour patience, but only if you size positions so you can survive the falls.
How much of your portfolio already rides on six companies? Book your free call with Alpesh's team (opens in a new tab). We will look at your real exposure across funds and shares, and show you a disciplined process for deciding what to hold, how much, and when to sell. There is nothing to buy on the call.
How have big tech stocks performed over 10 years?
Start with the scoreboard. These are price changes only, excluding dividends, from 4 November 2016 to 4 November 2026, adjusted for share splits.
| Company or index | 10-year rise | A year, compounded | Largest fall | Volatility, last year |
|---|---|---|---|---|
| Nvidia | +11,742% | +61.2% | -66% (2021-22) | 37% |
| Apple | +1,184% | +29.1% | -39% (2018-19) | 25% |
| Microsoft | +847% | +25.2% | -38% (2021-22) | 34% |
| Alphabet | +640% | +22.1% | -44% (2021-22) | 34% |
| Amazon | +605% | +21.6% | -56% (2021-22) | 34% |
| Meta | +422% | +18.0% | -77% (2021-22) | 41% |
| Nasdaq 100 | +510% | +19.8% | -36% (2021-22) | 20% |
| S&P 500 (SPY ETF) | +268% | +13.9% | -34% (2020) | 13% |
Source: Mag6 Watch, daily closing prices to 4 November 2026.
Every one of the six beat the S&P 500 over the decade. Even Meta, the slowest, grew 18.0% a year against 13.9% for the index. That is the headline most people remember.
Now look at the fourth column. Every one of them also fell further than the index at some point. Meta lost more than three-quarters of its value between September 2021 and November 2022. Amazon more than halved. The S&P 500's worst fall in the same decade was the 34% Covid crash of February and March 2020, and it was over in about five weeks.
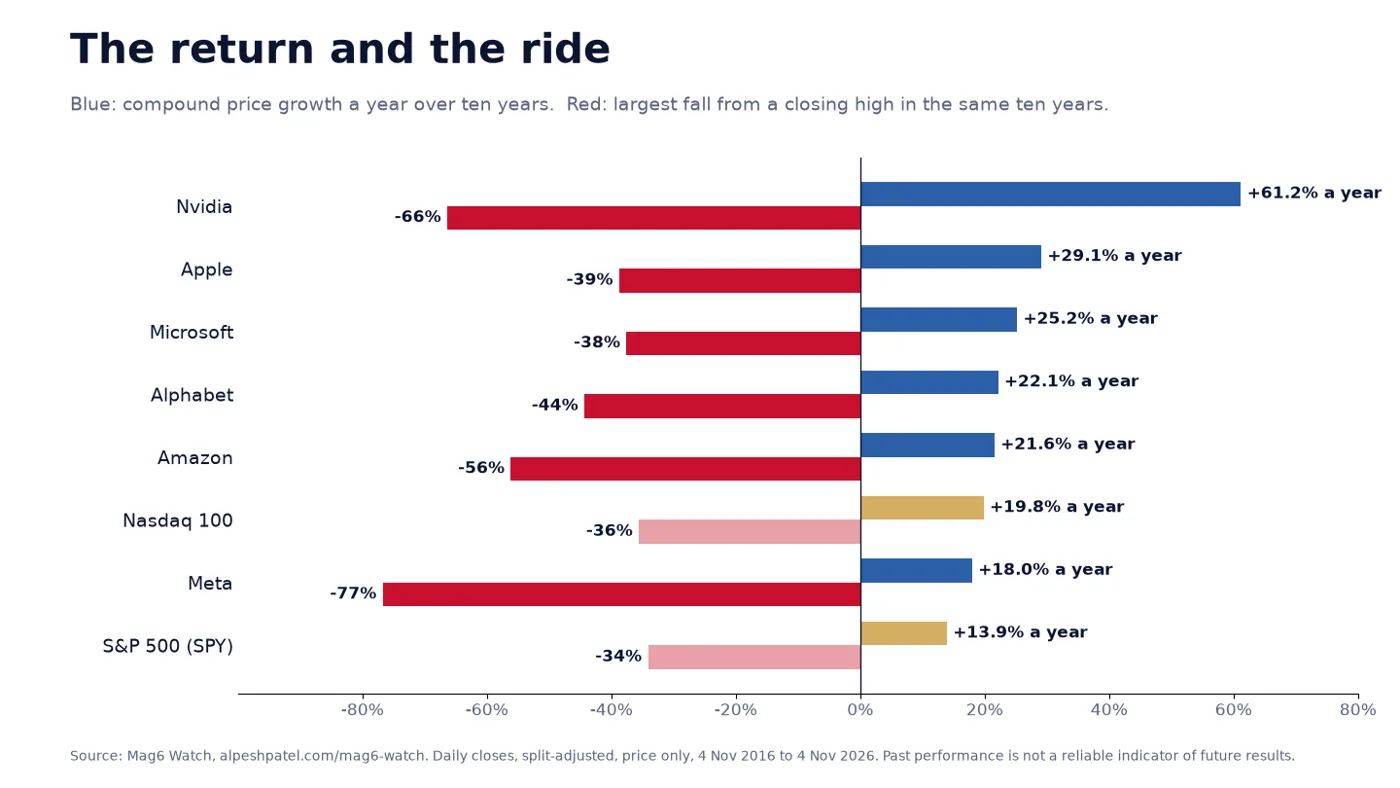
That is the trade you are making with big tech stocks. The extra return is real, and it is payment for a ride that most investors are not built for.
The volatility is not a one-off
Volatility measures how widely a price swings, expressed as a yearly figure. Over the last year Meta's was 41% and Nvidia's 37%, against 13% for the S&P 500. In plain English, a "normal" year for Meta includes swings roughly three times the size of the market's.
Beta tells the same story another way. Over the last year Nvidia moved, on average, 1.86% for every 1% move in the S&P 500. Amazon's beta was 1.47, Meta's 1.42 and Alphabet's 1.41. Apple, at 0.62, was the only one of the six that moved less than the market. If you want to understand what those numbers feel like in a portfolio, I explain it in what 20% volatility in a stock or fund really means.
Does holding big tech stocks for longer improve your odds?
Yes, and the data shows it clearly. Mag6 Watch counts every overlapping holding period in the ten years: every 1-day return, every 5-day return, and so on up to every 250-trading-day return, which is roughly a year. That is 2,263 one-year windows for each share.
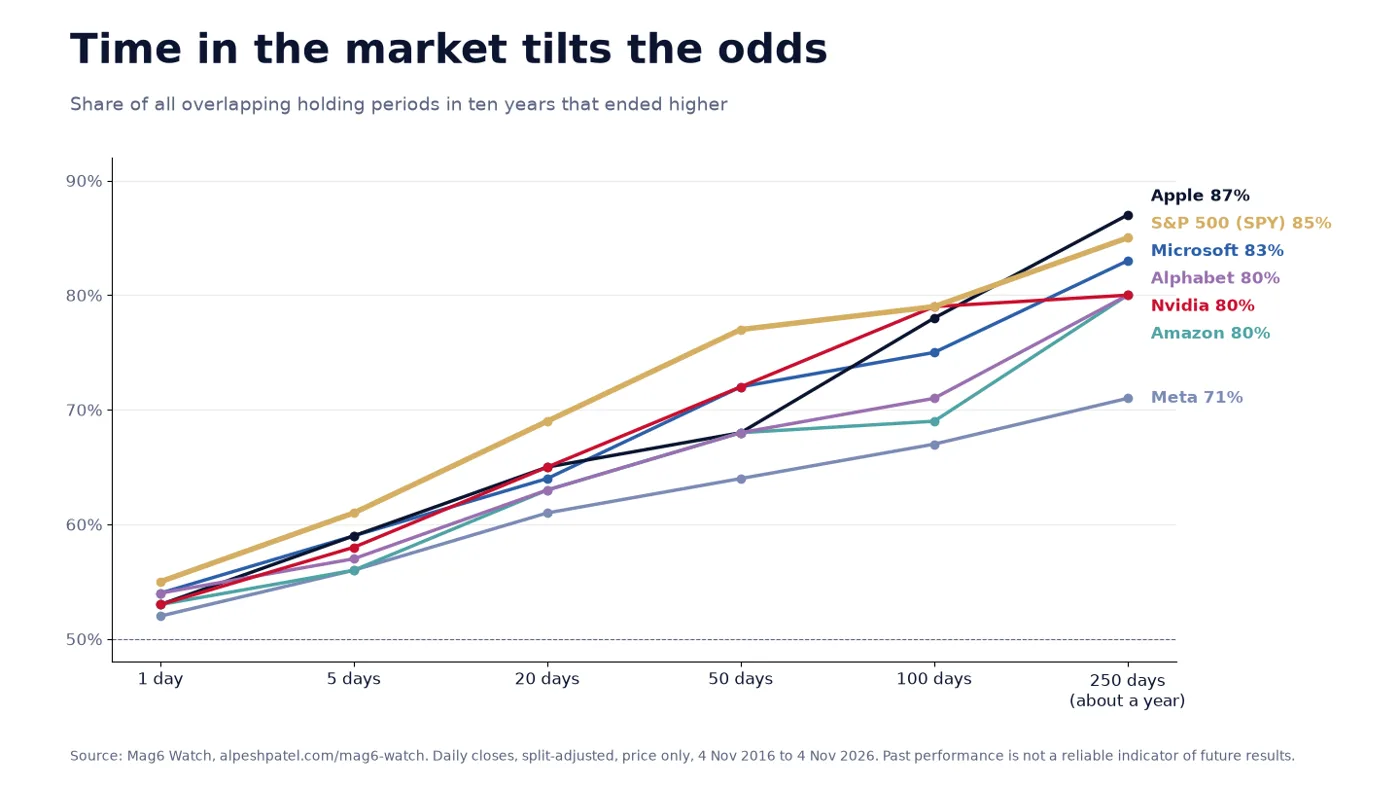
Held for a single day, every one of these shares was close to a coin toss. Meta rose on 52% of days, Microsoft and Alphabet on 54%, the S&P 500 on 55%. Anyone trading big tech stocks day to day is, statistically, flipping a slightly weighted coin and paying costs on every flip.
Held for about a year, the picture changes. Apple ended higher in 87% of one-year periods, Microsoft in 83%, and Amazon, Alphabet and Nvidia in 80%. The S&P 500 managed 85%. Meta lagged at 71%.
| Holding period | 1 day | 20 days | 100 days | 250 days |
|---|---|---|---|---|
| Apple | 53% | 65% | 78% | 87% |
| Microsoft | 54% | 64% | 75% | 83% |
| Nvidia | 53% | 65% | 79% | 80% |
| Amazon | 53% | 63% | 69% | 80% |
| Alphabet | 54% | 63% | 71% | 80% |
| Meta | 52% | 61% | 67% | 71% |
| S&P 500 | 55% | 69% | 79% | 85% |
Source: Mag6 Watch, share of all overlapping holding periods that ended higher, ten years to 4 November 2026.
Here is the surprise. At every holding period from 1 day to 50 days, the plain S&P 500 had better odds of a gain than any of the six giants. Only over 100 days and longer did some of the individual shares catch up, and only Apple beat the index's 85% over a year. The giants won on the size of their gains, not on how often they won.
The range of outcomes widens too
Longer holding periods tilted the odds in your favour, but they also stretched the range of outcomes in both directions. That is the part most "time in the market" advice leaves out.
Take the worst 1 in 20 one-year periods, known as the 5th percentile. For the S&P 500 it was a fall of 12%. For Microsoft, 18%. For Nvidia, 40%. For Meta, 54%. At the other end, the best 1 in 20 one-year periods gave Nvidia +220% and Meta +140%, against +35% for the index.
The typical one-year return, the median, was +67% for Nvidia, +29% for Microsoft, +28% for Alphabet, +25% for Apple, +24% for Meta and +20% for Amazon, against +15% for the S&P 500. I use the median rather than the average because a few spectacular years drag the average well above what a typical holder actually experienced.
So the honest summary is this. Holding big tech stocks for a year has historically won more often than not, and won big. But the bad years were genuinely bad, and you do not get to choose which year you are in.
In this video I go through why most investors cannot survive a serious market downturn, and the checks I use so a fall does not force a bad decision.
Where are big tech stocks now compared with their history?
This is where the latest data gets interesting, because the six giants have split into two very different groups. Mag6 Watch ranks the latest return for each holding period against every period of the same length in the last ten years. The 99th percentile means the latest return beat 99% of history; the 1st means only 1% of periods were worse.
The leaders, near their highs. Microsoft closed 0.6% below its 52-week high and Apple 1.4% below. Microsoft's latest 100-day return of +42% ranked in the 99th percentile of its ten-year history. Apple was up 28.6% in 2026 to date. On 4 November alone, Microsoft rose 6.7%, Amazon 6.1% and Apple 5.3%, each a 99th-percentile day.
The laggards, in the bottom few per cent. Alphabet closed 29.3% below its 52-week high. Its latest 5-day return of -11% and 20-day return of -18% both ranked in the 1st percentile: in ten years, it has almost never fallen this far, this fast. Nvidia's 20-day return of -16% ranked in the 6th percentile, and Meta's -13% in the 8th. Even the Nasdaq 100, down 8.7% over 20 days, was in its 4th percentile.
| Latest return | 20 days | Percentile | 100 days | Percentile | From 52-week high |
|---|---|---|---|---|---|
| Microsoft | +4.9% | 70th | +42% | 99th | -0.6% |
| Apple | +3.8% | 56th | +20% | 73rd | -1.4% |
| Amazon | +2.4% | 49th | +12% | 56th | -7.4% |
| Meta | -13% | 8th | +11% | 54th | -19.2% |
| Nvidia | -16% | 6th | -2.5% | 18th | -17.8% |
| Alphabet | -18% | 1st | -20% | 3rd | -29.3% |
| S&P 500 | -1.3% | 21st | +3.4% | 33rd | -1.9% |
Source: Mag6 Watch, latest returns to 4 November 2026 ranked against ten years of history.
These figures run to the close on 4 November. The next day, the S&P 500 fell 4.4% (opens in a new tab) in the worst day for AI stocks in a year and a half, which I covered in AI panic? What the data says. The next Mag6 Watch refresh will show how far that has moved the rankings.
Extremes are worth noticing, not acting on
A 1st-percentile fall is tempting. It feels like a bargain. Sometimes it is, and sometimes it is the first stage of a much longer decline. Alphabet's history includes a 44% fall from November 2021 to November 2022; Meta's includes 77%. Nothing in a percentile ranking tells you which kind of fall you are looking at.
It works the other way too. A 99th-percentile run, like Microsoft's last 100 days, says the share has had an unusually strong stretch. It does not say the strength must end. What these rankings are good for is a question: has something changed, or is this noise? That question needs a process to answer it, not a gut feeling.
Why concentration risk matters for UK investors
There is one more number that matters more than any of the above. If you own a global or US index fund, you already own a lot of these six companies.
According to Charles Schwab (opens in a new tab), the Magnificent Seven made up about 34% of the S&P 500's market value by August 2026. In other words, every USD 10,000 in an S&P 500 tracker puts roughly USD 3,400 into seven companies. Institutional Investor (opens in a new tab) reports that the seven peaked at 35% of the index in early June 2026, against an average weight for the seven largest S&P 500 companies of roughly 17% since 1957.
Many UK investors hold a global tracker in a SIPP, a US tracker in an ISA, a technology trust on top, and then a few of these shares directly because they know the names. Each holding looks sensible on its own. Added together, they can leave a large share of a retirement pot riding on six companies with a history of 40% to 77% falls. I looked at this in more depth in S&P 500 concentration: should the Magnificent Seven worry you?.
These are the winners, picked in hindsight
One honest caveat about all of this data. These six are on the dashboard because they became the biggest companies in the world. In November 2016, nobody could be sure of that. Their history is a survivor's history, and it says little about how the next decade's winners, or these same companies, will do.
How I would use this data: a three-column check
When I was a barrister, I learned to cross-examine my own case before the other side did. I still do that with every share I own, using three columns on a single sheet of paper.
Column one: why I like it. The reasons, written down. Not "everyone owns it", but the specific things that would have to stay true: earnings growth, cash flow, competitive position, the trend in the price.
Column two: the challenges. Everything that could go wrong, as the other side's barrister would put it. For big tech stocks today that list writes itself: the sheer scale of AI spending, regulation, crowding, and the fact that these shares have already fallen 40% to 77% within the last decade.
Column three: my replies. An honest answer to each challenge. Where I cannot answer one, that is a warning, and it should reduce how much I hold.
The Mag6 Watch data feeds straight into this. It tells you how bad "bad" has been for each share, so you can size a position you could live through. It tells you how often each share has won over the period you actually plan to hold. And it tells you when a share is at an extreme, which is the moment to rerun the three columns rather than react.
What to do next
- Add up your real exposure. List every fund, trust and share you own, and estimate how much of the total sits in these six companies. Include index funds; that is where most of the hidden exposure lives.
- Size for the worst fall, not the average year. For each big tech holding, ask what happens to your plan if it falls by its ten-year worst: 66% for Nvidia, 77% for Meta. If that would force you to sell, the position is too big.
- Match your holding period to the odds. The data shows day-to-day and week-to-week moves in these shares are close to a coin toss. If you are buying, decide in advance how long you intend to hold, and why.
- Write your three columns. For any share you hold directly, write down why you own it, what could go wrong, and your answer to each challenge. Revisit it when Mag6 Watch shows a share at an extreme.
- Check the dashboard every fortnight. Mag6 Watch refreshes every two weeks, and the weekly Markets this week page gives the wider picture.
Want a second pair of eyes on your exposure to big tech stocks? Book your free call with Alpesh's team (opens in a new tab). We will show you how much of your portfolio really depends on six companies, and a disciplined process for deciding what to hold, how much, and when to sell.
Frequently asked questions
Which big tech stock has performed best over 10 years?
Nvidia, by a wide margin. Its share price rose 11,742% in the ten years to 4 November 2026, or 61.2% a year compounded, against 13.9% a year for the S&P 500. It also fell 66% from November 2021 to October 2022 along the way.
How often do big tech stocks go up over a year?
In the ten years to 4 November 2026, Apple ended higher in 87% of one-year periods, Microsoft in 83%, Amazon, Alphabet and Nvidia in 80%, and Meta in 71%. The S&P 500 ended higher in 85%. Past patterns are not a guide to future results.
Are the Magnificent Seven too big a part of the S&P 500?
They made up about 34% of the S&P 500 by August 2026, according to Charles Schwab, against a long-run average of about 17% for the seven largest companies. That means index investors already hold a large stake in them, so buying them directly as well can double up the same risk.
Is it a good time to buy big tech stocks after a fall?
Nobody can know. On 4 November 2026, Alphabet's 20-day fall ranked in the bottom 1% of its ten-year history, but past falls in these shares have stretched to 44% for Alphabet and 77% for Meta. An extreme reading is a reason to review your process, not a signal by itself.
About Alpesh Patel OBE
Alpesh Patel OBE is Founding Principal of Rootbridge Capital, an author and Dealmaker for the UK Government's Department for Business. He is a former Visiting Fellow in Business, Corpus Christi College, Oxford University, where he worked on technology to improve financial education.
Sources
- Alpesh Patel OBE, Mag6 Watch: the six giants, by the numbers: daily closing prices, adjusted for share splits, price only, ten years to 4 November 2026
- Charles Schwab, What are the Magnificent 7 stocks? (opens in a new tab), 2026
- Institutional Investor, Is the S&P 500's concentrated rally starting to diversify? (opens in a new tab), 2026
- Chicago Tribune / Associated Press, A brutal sell-off for AI stocks sends Wall Street reeling (opens in a new tab), 5 November 2026
Important: This article is for education only and is not personal financial advice or a recommendation to buy or sell any investment. This article is general investment education only and is not regulated investment advice. The value of investments can go down as well as up, and you may get back less than you invest. Past performance is not a reliable indicator of future results.
Important: this article is education and information only. It is not financial advice or a personal recommendation, and it does not take your circumstances into account. The value of investments and pensions can fall as well as rise, and you may get back less than you put in. Past performance is not a reliable indicator of future results. Figures were correct when the article was written and may have changed. If you are unsure what is right for you, speak to a regulated financial adviser.