Is 20% a Year Realistic? What It Takes and What It Risks
Over the 60 years to the end of 2024, Berkshire Hathaway shares compounded at 19.9% a year. That is the record Warren Buffett reports in his 2024 letter to shareholders (opens in a new tab), against 10.4% a year for the S&P 500 with dividends. It is one of the best-documented long records of anything close to 20% a year.
Now the part that rarely makes the headlines. In his 2017 letter (opens in a new tab), Buffett listed four "truly major dips" in Berkshire's share price: 59.1% in 1973–75, 37.1% in October 1987, 48.9% in 1998–2000 and 50.7% in 2008–09. One of the most celebrated records in modern investing came with the shares halving three times and falling by more than a third a fourth time.
So when an investor asks whether 20% a year is realistic, the honest answer has two halves. Is it possible? Occasionally, for a very few people. Is it something you can plan a retirement around? That is a different question, and the answer starts with what 20% a year asks of you.
Short answer: Is 20% a year realistic? Over long periods it is rare. US shares returned 9.8% a year from 1900 to 2025 and the S&P 500 about 10% a year since 1928. A few investors have compounded near 20%, but with 40% to 60% falls along the way. Plan on a lower figure and size your risk to it.
Not sure what return your own plan really needs? Book your free call with Alpesh's team. We will walk through how self-directed investors set a written target, choose investments and decide how much risk to take. There is nothing to buy on the call.
Is 20% a year realistic? What 126 years of data say
The best long-run record of market returns is the UBS Global Investment Returns Yearbook, compiled by Elroy Dimson, Paul Marsh and Mike Staunton. The 2026 summary edition (opens in a new tab) shows US shares returned 9.8% a year from 1900 to 2025, or 6.6% a year after inflation. US bonds returned 4.6% a year and Treasury bills 3.4%.
Across all developed markets, shares returned 8.5% a year since 1900, according to the UBS Yearbook 2026 release (opens in a new tab). That is the reward for owning businesses through two world wars, a depression, oil shocks and the dot-com bust.
The S&P 500 tells a similar story. On the NYU Stern historical returns data (opens in a new tab) compiled by Professor Aswath Damodaran, the index returned 10.0% a year compounded from 1928 to 2025 with dividends reinvested. Over the 10 years from 2016 to 2025, a strong decade led by large technology companies, it returned 14.7% a year.
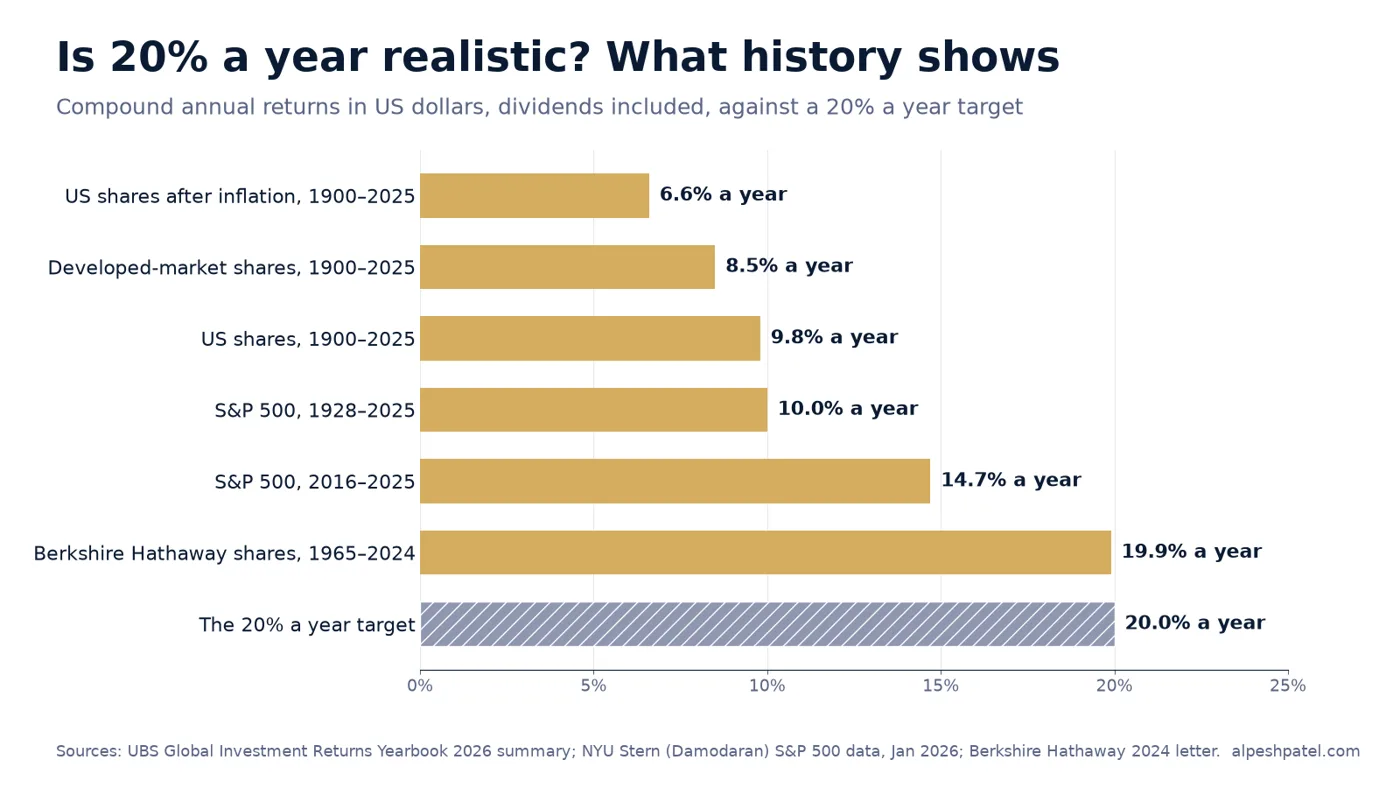
Source: UBS Global Investment Returns Yearbook 2026 summary; NYU Stern (Damodaran) S&P 500 data, January 2026; Berkshire Hathaway 2024 letter. Returns in US dollars.
Put simply, 20% a year is roughly double what the broad US market has delivered over the past century. Even the best decade in recent memory fell well short of it. Anyone promising 20% a year as a steady, expected return is promising something the market as a whole has never done.
What does 20% a year do to £100,000?
The appeal is obvious once you see the compounding. The table below shows £100,000 left to grow, with nothing added or taken out.
| Illustrative: £100,000 growing at | After 10 years | After 20 years | Rule of 72: years to double |
|---|---|---|---|
| 7% a year | £196,715 | £386,968 | about 10.3 |
| 10% a year | £259,374 | £672,750 | about 7.2 |
| 15% a year | £404,556 | £1,636,654 | about 4.8 |
| 20% a year | £619,174 | £3,833,760 | about 3.6 |
Illustrative calculation, compounded annually. Ignores charges, tax and inflation. Not a forecast.
The rule of 72 is a quick way to check any claim. Divide 72 by the yearly return and you get roughly how many years it takes to double your money. At 7% that is about ten years. At 20% it is under four.
The gap between the rows is enormous. After 20 years, 20% a year leaves you with almost ten times what 7% does. That is exactly why the number is so tempting, and why it is so often used in marketing.
Why the average return is not the return you get
There is a quieter trap in the maths. Suppose a portfolio rises 60% one year and falls 20% the next. The simple average is 20% a year. But £100,000 becomes £160,000 and then £128,000. The compound return is about 13.1% a year, not 20%.
Losses also need bigger gains to recover. A 20% fall needs a 25% gain to get back to where you started. A 50% fall needs a 100% gain. The S&P 500 lost 36.55% in 2008 on the NYU Stern data (opens in a new tab), which needed a gain of about 58% just to break even.
The more a portfolio swings, the wider the gap between its average return and the compound return you actually keep. My piece on what 20% volatility in a stock or fund means explains how to read that risk number.
How many fund managers keep up top performance?
If 20% a year were a skill that a manager could simply repeat, you would expect the best managers to stay at the top. S&P Dow Jones Indices tests this every year in its persistence scorecard, and the results are humbling.
According to the SPIVA U.S. Persistence Scorecard Year-End 2025 (opens in a new tab), none of the top-quartile funds from 2021 in any reported active US equity category, apart from small-cap funds, remained in the top quartile in each year through 2025. Only 4.5% of above-median large-cap funds stayed above median over that period, below the 6.25% you would expect from pure chance.
Shorter runs look better. The same report found 29% of top-quartile large-cap funds in 2023 held that position for the next two years. But over five years, the leaders mostly stopped leading.
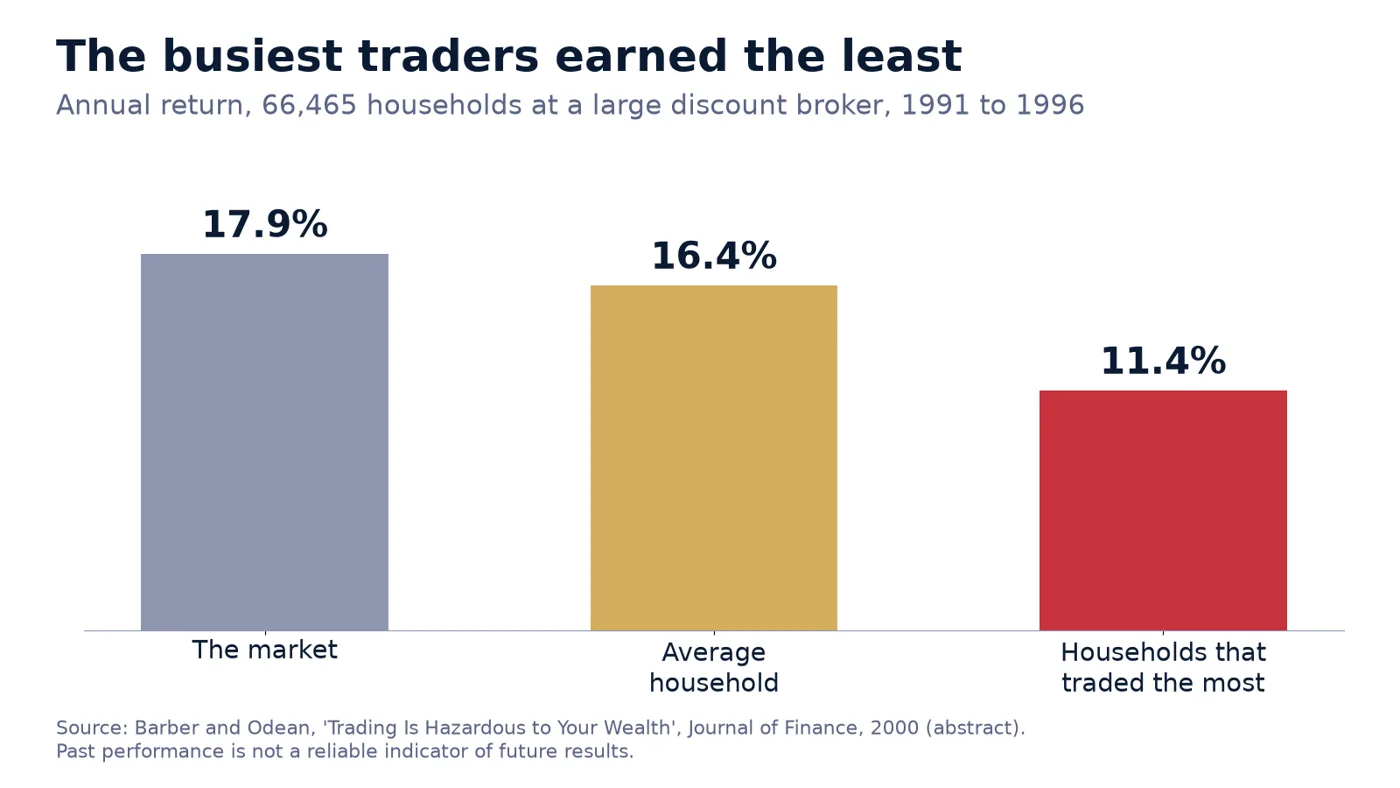
There is a lesson for private investors here as well. The Morningstar Mind the Gap 2026 (opens in a new tab) study found the average dollar invested in US funds earned 8.7% a year over the 10 years to 31 December 2025, against 9.9% a year for the funds themselves. The difference came from investors buying and selling at the wrong moments. Chasing high returns tends to make that worse, not better.
What risks come with chasing 20% a year?
The table below puts the cost of high returns in plain numbers. These are real falls, not hypothetical ones.
| Real-world falls | Fall | Gain needed to recover |
|---|---|---|
| Berkshire Hathaway shares, Mar 1973 to Jan 1975 | 59.1% | about 145% |
| Berkshire Hathaway shares, Sep 2008 to Mar 2009 | 50.7% | about 103% |
| Berkshire Hathaway shares, Jun 1998 to Mar 2000 | 48.9% | about 96% |
| S&P 500 in calendar year 1931 | 43.84% | about 78% |
| S&P 500 in calendar year 2008 | 36.55% | about 58% |
| S&P 500 in calendar year 2022 | 18.04% | about 22% |
Sources: Berkshire Hathaway 2017 letter (opens in a new tab) (share price falls); NYU Stern S&P 500 data (opens in a new tab) (calendar-year total returns). Recovery gain is simple arithmetic.
The UBS researchers make the same point over a longer span. Since 1900, they note, both shares and bonds have each lost more than 70% in real terms on several occasions, according to the 2026 summary edition (opens in a new tab). A 60:40 mix of shares and bonds never fell more than 50%.
To aim for 20% a year, a portfolio usually has to be more concentrated than the market. That might mean fewer holdings, a heavy tilt to fast-growing companies, smaller companies or a single theme. Each of those can work. Each also makes falls of 40% or more more likely, and more likely to arrive at the wrong time.
Three risks matter most for someone investing for retirement:
- Timing risk. A 50% fall in your final years before retirement, or in the first years of taking income, can do damage that later gains never fully repair.
- Behaviour risk. Most people who own a concentrated portfolio sell after a big fall, often near the bottom. The Morningstar gap above is the evidence.
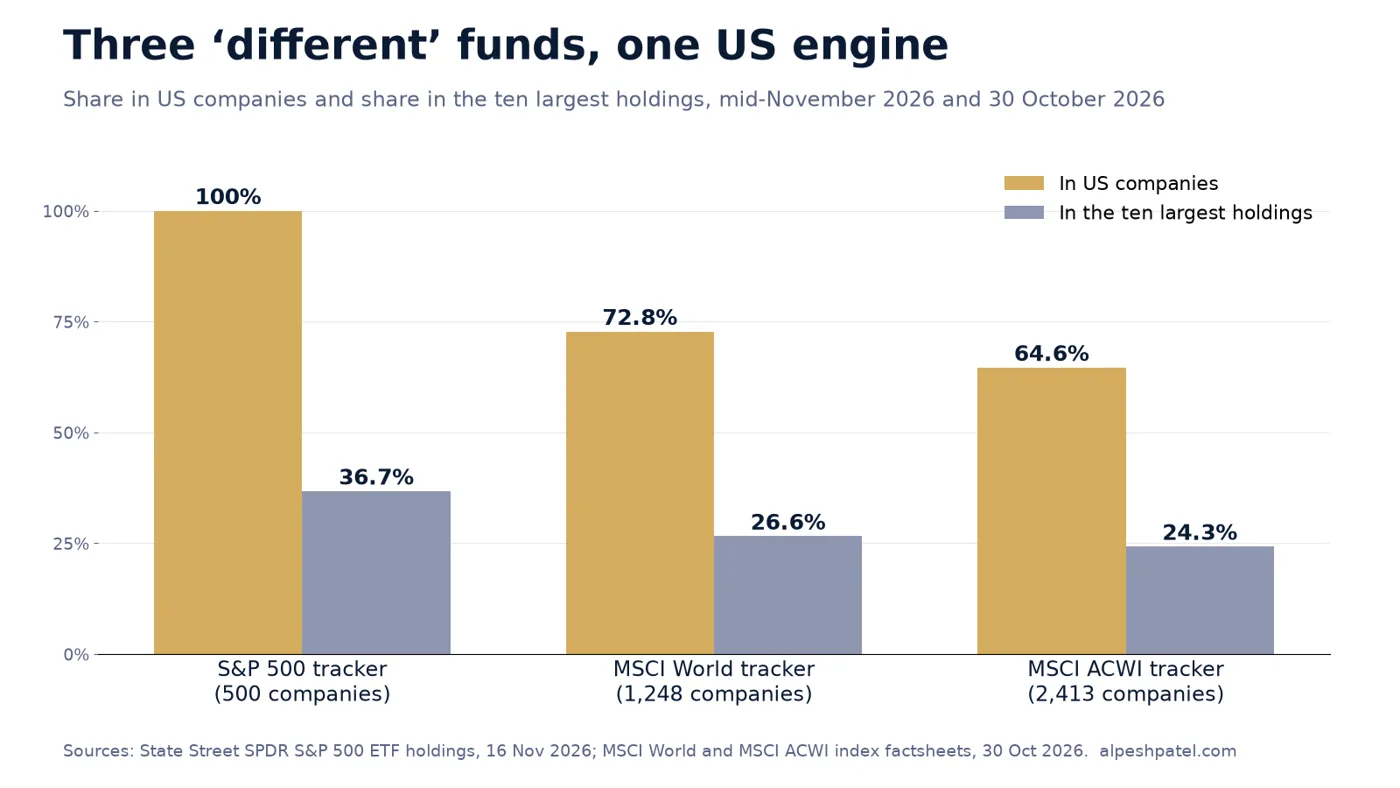
- Concentration risk. If a large part of your money sits in a few names, one bad result can sink the plan. My look at S&P 500 concentration and the Magnificent Seven shows how even the index has become top-heavy.
What does it take to aim high without blowing up?
None of this means ambition is wrong. Some years a well-run portfolio will beat 20%. Some investors, through skill, discipline and a long time horizon, will beat the market over many years. The question is how you pursue higher returns without staking everything on getting them.
In my experience, the investors who do best with high-conviction ideas have three things written down before they buy.
How they pick. A clear set of tests for what goes in, so each holding is there for a reason you can state in a sentence. The pick stocks with a process guide sets out the steps.
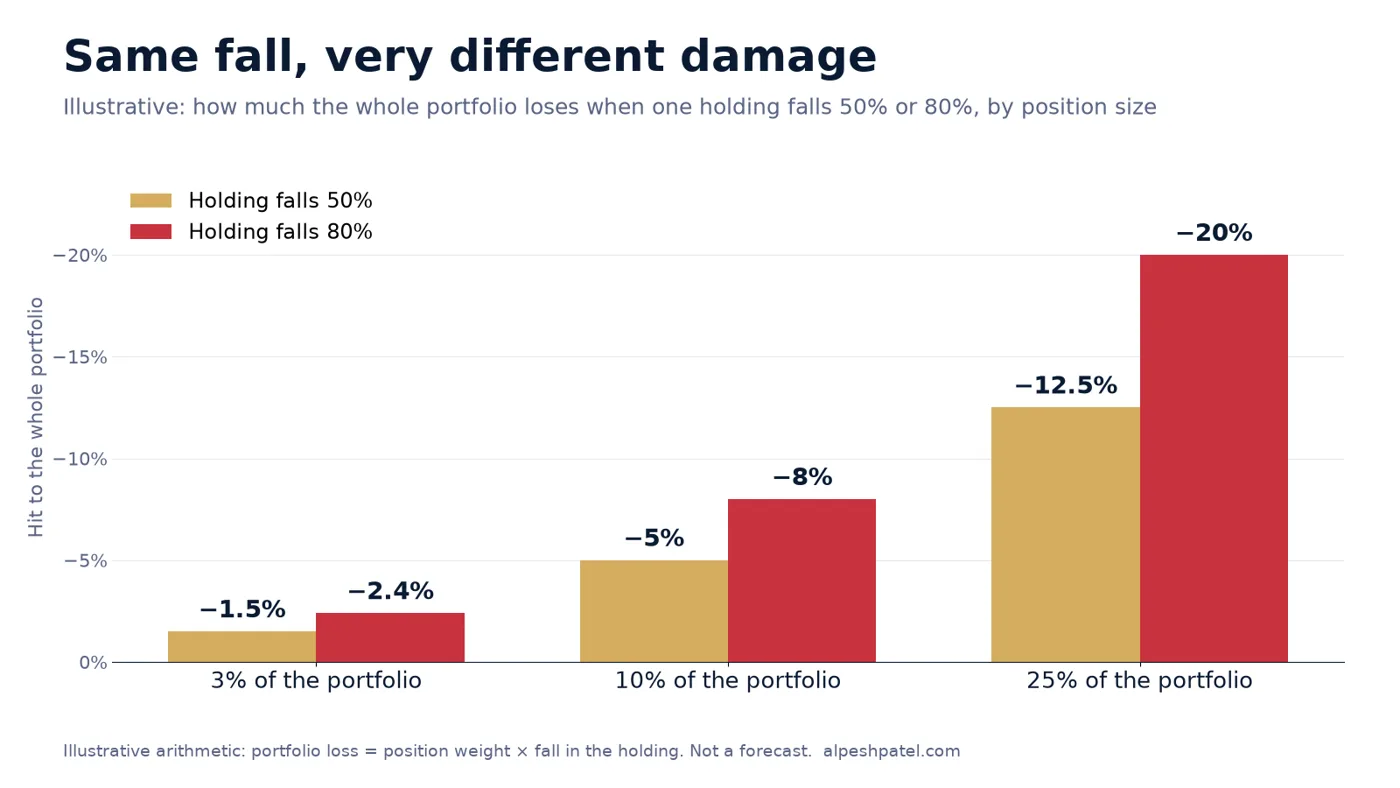
How much they put in. Position sizing is where most of the risk control lives. A higher-risk idea gets a smaller slice, so that if it halves, the whole portfolio does not. My guide to position sizing for high-conviction investing works through the numbers.
When they sell or rebalance. A rule set in advance, for example trimming a holding that has grown past a set share of the portfolio, or reviewing anything that falls a set amount. It removes the guesswork in the moment when emotions run highest.
This is also the case for managing your own money. You see every holding and every charge. You decide how much risk to take, matched to your own goals and nerves rather than a model portfolio built for an average saver. And when a fall comes, you know why you own what you own.
How to set a written return target and size risk to it
Start from what you need, not what you hope for. If your plan only works at 20% a year, the plan is fragile. If it works at 6% or 7% and anything above that is a bonus, you can afford to take some measured risks with part of the money.
A simple way to set it out:
- Work out the return your goal needs. Use the Pension Plan (opens in a new tab) or FIRE (opens in a new tab) calculators with your pot, contributions and time to retirement.
- Decide the biggest fall you could live with without selling. Be honest. If a 30% drop would make you sell, your portfolio should not be built to fall 50%.
- Test the mix. Portfolio Odds (opens in a new tab) explores how often a given mix has lost money over different holding periods, and the Probability (opens in a new tab) tool helps you think about the odds of a move in a share or index.
- Split core and satellite if you want ambition. A broad, low-cost core aims for the market return. A smaller satellite holds higher-conviction ideas with strict size limits.
More free calculators sit on the tools page, and the protect your portfolio in a crash guide covers the defensive side.
What to do next
- Write down the return your plan actually needs, using your own figures rather than a headline number.
- Set your maximum acceptable fall and check your current portfolio against it.
- Cap any single holding at a size you could see halve without derailing the plan.
- Write your sell and rebalance rules before you need them, and put a review date in the diary.
- Judge results over years, not months, and compare them with a simple benchmark such as a global index fund.
Want a written target and a process for sizing your risk to it? Book your free call with Alpesh's team. We will show you how self-directed investors pick investments, size positions and decide when to sell, so your ambitions come with a plan you can stick to. There is nothing to buy on the call.
Frequently asked questions
Is 20% a year a realistic return on investments?
As a steady, long-term expectation, no. US shares returned 9.8% a year from 1900 to 2025 and the S&P 500 about 10% a year since 1928. Individual years of 20% or more are common, but sustaining it for decades is very rare and comes with large falls.
What is a realistic annual return for a stock market portfolio?
History suggests high single digits a year before inflation for a broad share portfolio, and about 6% to 7% after inflation for US shares over the very long run. Returns vary widely from decade to decade, so plans should be tested at lower figures too.
How long does it take to double money at 20% a year?
Using the rule of 72, about 3.6 years, and closer to 3.8 years on exact maths. At 7% a year it takes about ten years. The rule only works if the return is achieved, which is the hard part.
Do top fund managers keep beating the market?
Rarely for long. The SPIVA U.S. Persistence Scorecard Year-End 2025 found that, outside small-cap funds, none of the top-quartile US equity funds from 2021 stayed in the top quartile in each year to 2025.
How much risk do I need to take to aim for high returns?
More than most people expect. Concentrated, high-growth portfolios can fall 40% to 60% in bad markets. Size each idea so that a fall of that kind would hurt but not ruin your plan, and keep a broad core alongside it.
About Alpesh Patel OBE
Alpesh Patel OBE is Founding Principal of Rootbridge Capital, an author and Dealmaker for the UK Government's Department for Business. He is a former Visiting Fellow in Business, Corpus Christi College, Oxford University, where he worked on technology to improve financial education.
Sources
- Berkshire Hathaway, 2024 letter to shareholders (opens in a new tab)
- Berkshire Hathaway, 2017 letter to shareholders (opens in a new tab)
- UBS, Global Investment Returns Yearbook 2026: public summary edition (opens in a new tab)
- UBS, Global Investment Returns Yearbook 2026: news release (opens in a new tab)
- NYU Stern, Aswath Damodaran, Historical returns on stocks, bonds and bills (opens in a new tab)
- S&P Dow Jones Indices, U.S. Persistence Scorecard Year-End 2025 (opens in a new tab)
- Morningstar, Mind the Gap (opens in a new tab)
- Alpesh Patel OBE, Returns without Blowing Up Your Pension: Part 2 (opens in a new tab) (YouTube)
Important: This article is for education only and is not personal financial advice or a recommendation to buy or sell any investment. This article is general investment education only and is not regulated investment advice. The value of investments can go down as well as up, and you may get back less than you invest. Past performance is not a reliable indicator of future results.
Important: this article is education and information only. It is not financial advice or a personal recommendation, and it does not take your circumstances into account. The value of investments and pensions can fall as well as rise, and you may get back less than you put in. Past performance is not a reliable indicator of future results. Figures were correct when the article was written and may have changed. If you are unsure what is right for you, speak to a regulated financial adviser.