Too Many Funds, Same Index? How to Diversify Across Accounts You Can't Combine
Picture a seven-figure portfolio, around $1.8 million or £1.4 million, spread across a string of accounts that cannot be merged: old and current workplace plans, a couple of personal pensions or IRAs, an ISA or two. Over the years the owner has picked about eleven funds across those accounts. Different names, different providers, different fact sheets.
Then they line up the top holdings and find the same engine in almost every one. Apple, Microsoft, Nvidia, Amazon, Alphabet. Too many funds, same index. On 16 November 2026 the ten largest holdings of the State Street SPDR S&P 500 ETF made up 36.74% of the fund, according to State Street's daily holdings file (opens in a new tab). Own eleven funds that all lean on the S&P 500 and you own that concentration eleven times.
Their goal is to double the money in ten years. That is a reasonable aim. But the route is not more funds pulling the same way. It is one mix, set once for the whole portfolio, then placed account by account.
Short answer: If you own too many funds tracking the same index, decide one mix for your whole portfolio: a US core, outside-US shares, smaller companies, and bonds or cash. Then let the accounts with the narrowest fund menus hold the S&P 500 core and use the accounts with the widest choice to diversify. Doubling in ten years needs about 7.2% a year.
Own a lot of funds but not sure how different they really are? Book your free call with Alpesh's team. We will show you how self-directed investors set one mix across many accounts and decide what each account should hold. There is nothing to buy on the call.
Why do so many of my funds hold the same shares?
Because most large funds are built from the same few indices, and those indices are weighted by company size. The biggest companies get the biggest slice, whatever the fund is called.
The S&P 500 covers approximately 80% of available US market capitalisation, according to S&P Dow Jones Indices (opens in a new tab). So a "total US market" fund is still about four-fifths the same companies. A "global" fund is often not far behind. On 30 October 2026 the MSCI World was 72.77% in US companies (MSCI World factsheet (opens in a new tab)) and even the MSCI ACWI, which includes emerging markets, was 64.63% in the US (MSCI ACWI factsheet (opens in a new tab)).
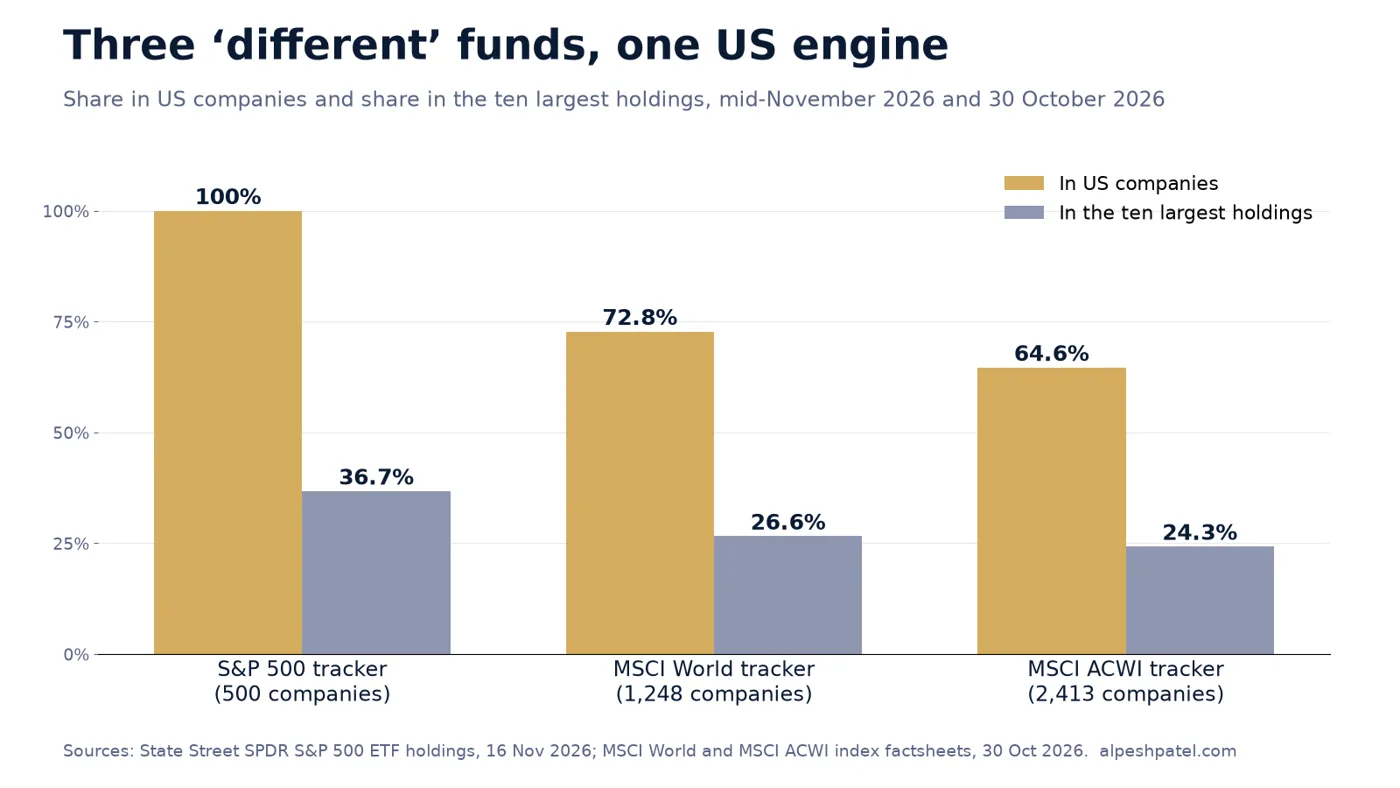
Source: State Street SPDR S&P 500 ETF holdings, 16 November 2026; MSCI World and MSCI ACWI index factsheets, 30 October 2026.
Now add the target-date fund in a workplace plan, the US large-cap fund in an IRA or SIPP and the "global growth" fund in an ISA. Each one is a sensible choice on its own. Together they can leave most of the portfolio riding on the same few hundred US companies, and a quarter to a third of it on ten of them.
| Index tracked | Companies | In US | In top ten |
|---|---|---|---|
| S&P 500 | 500 | 100% | 36.74% |
| MSCI World | 1,248 | 72.77% | 26.58% |
| MSCI ACWI | 2,413 | 64.63% | 24.26% |
Sources: S&P 500 top ten from the SPDR S&P 500 ETF holdings (opens in a new tab), 16 November 2026; MSCI World (opens in a new tab) and MSCI ACWI (opens in a new tab) factsheets, 30 October 2026. Index figures; a fund tracking each index will differ slightly. Not a recommendation of any fund.
Is it bad to own too many funds?
Owning many funds is not wrong in itself. The problem is owning many funds that behave as one. You pay several sets of charges, read several sets of statements and feel diversified, while the portfolio rises and falls with a single engine.
You can see this in the top ten of each fund. If Apple, Microsoft and Nvidia head the list in most of them, the number of funds is telling you very little about your risk. What matters is the mix underneath: how much is in large US companies, how much outside the US, how much in smaller companies, and how much in bonds or cash.
I have written about why "just buy the S&P 500" is not a process and about S&P 500 concentration and the Magnificent Seven. This post takes the practical next step: what to do when your money is split across accounts you cannot bring together.
How do I diversify across accounts I can't combine?
Stop thinking account by account. Think of all your accounts as one portfolio with several drawers. You decide the mix once, at the top. Then you decide which drawer holds which part.
Step 1: Decide the whole-portfolio mix once
Write down a target for each building block across everything you own. The mix depends on your goal, your timeline and how big a fall you could sit through, so there is no single right answer.
| Illustrative building block | Example target | Typical role |
|---|---|---|
| Large US companies (the S&P 500 core) | 45% | Main growth engine |
| Shares outside the US | 25% | Different economies, currencies and sectors |
| Smaller companies | 10% | Different drivers from the giants |
| Bonds and cash | 20% | Steadier money for falls and near-term needs |
Illustrative only, to show the format. Not a recommendation; your own mix should reflect your risk profile and timeline.
Step 2: Give the narrowest menus the S&P 500 core
Workplace plans often offer a short fund list, and the cheapest, simplest option is frequently an S&P 500 or US index fund. That is fine. Let those accounts hold your US core. A narrow menu is not a flaw if you give it the job it does best.
Step 3: Use the widest-choice accounts to diversify
Personal pensions, SIPPs, IRAs and ISAs on a broad platform usually let you choose from thousands of funds and shares. Use them for the parts the narrow accounts cannot reach: outside-US shares, smaller companies, and the bonds or cash that steady the whole. Each piece is sized to your whole-portfolio target, not to that account.
In an illustrative example, if 45% of a £1.4 million portfolio should be the US core, that is £630,000. If the workplace plans already hold £600,000 in S&P 500 funds, the US core is almost done. The wider accounts should then hold very little in US large companies and focus on the rest.
Does it matter which account holds which fund?
Yes, because different accounts are taxed differently. This is called asset location, and it can matter as much as the fund charges.
In the UK, you do not pay tax on income or gains inside an ISA, and the ISA allowance is £20,000 for 2026 to 2027 (GOV.UK (opens in a new tab)). Pensions get tax relief going in, but most withdrawals are taxed as income, with a tax-free lump sum capped by the lump sum allowance (GOV.UK (opens in a new tab)). In the US, a Roth IRA takes contributions that are not deductible, and qualified withdrawals are tax-free (IRS (opens in a new tab)), while traditional IRAs and 401(k) plans generally defer tax until you withdraw.
A common line of thinking is to hold the parts you expect to grow most where growth is tax-free, and the income-heavy parts, such as bonds, where income is sheltered. But the rules differ by country, by account and by your own situation, especially if you have accounts in more than one country. A tax specialist should confirm what applies to you before you move anything.
One more caution. If an account carries guarantees, an employer match or valuable protected benefits, keep it. Diversifying inside it is very different from transferring out. My guide to whether to combine your pensions covers those checks.
How much do I need to double my money in ten years?
About 7.2% a year, after charges. The rule of 72 gives a quick answer: divide 72 by the annual return to get roughly how many years it takes to double. The exact figure for ten years is 2 to the power of one tenth, minus one, which is 7.18%.
| Years to double | Return needed each year |
|---|---|
| 8 | 9.05% |
| 10 | 7.18% |
| 12 | 5.95% |
| 15 | 4.73% |
Illustrative calculation, compound annual return with no contributions or withdrawals. Not a forecast.
On those numbers, an illustrative £1.4 million would need 7.18% a year to reach £2.8 million in ten years. Fees matter here. A portfolio paying 1% more a year in charges needs a gross return of about 8.2% to deliver the same 7.2%. My post on what 1% a year in wealth management fees costs works through that drag.
You do not need eleven funds pulling the same way to reach 7.2%. You need a mix with a reasonable chance of getting there that you would still hold after a bad day. The free Portfolio Odds (opens in a new tab) tool lets you explore the chance of a loss for a given mix under its assumptions, and the Probability (opens in a new tab) tool shows the spread of outcomes. More are on the tools page.
Why a mix you would hold after a bad day beats a perfect one
The best mix on paper is worthless if you sell it in a panic. A portfolio that is all US large companies can do brilliantly for years and then fall hard and fast, and the investor who never expected that is the one who sells near the bottom.
Diversifying across regions, company sizes and bonds does not stop falls. It changes their shape. Some parts fall less, some recover on a different timetable, and the whole is easier to live with. That is what lets you keep going long enough for the ten-year maths to work.
This is the case for managing your own money with a written process. Control: you set the mix across every account, rather than eleven fund managers each making their own choices. Transparency: you can see what you own in total and what it costs. And a portfolio built for your risk profile rather than an average saver's. The process needs three parts: how you pick, how much you hold of each and when you rebalance or sell. The invest a lump sum and US and global shares guides set out the steps.
Related: Gold miners: four holdings, one bet.
What to do next
- List every account and fund. Note the value, the fund, its charge and its top ten holdings in one spreadsheet.
- Add up the real mix. Work out what share of the total is in US large companies, outside-US shares, smaller companies, and bonds or cash.
- Write your target mix. One set of percentages for the whole portfolio, based on your goal, timeline and the fall you could sit through.
- Assign jobs to accounts. Narrow-menu accounts hold the S&P 500 core; wide-choice accounts fill the gaps. Ask a tax specialist to confirm the asset location before switching.
- Set a rebalancing date. Once or twice a year, check the total against your target and adjust in the account where it is cheapest and simplest to do.
Want one clear plan across all your accounts? Book your free call with Alpesh's team. We will show you how self-directed investors set a whole-portfolio mix, decide which account holds what and rebalance on a schedule. There is nothing to buy on the call.
Frequently asked questions
How many funds should I own?
There is no magic number. A handful of genuinely different funds can diversify more than a dozen that track the same index. Judge by the mix underneath, not the count.
How do I check fund overlap?
Compare the top ten holdings and the country and sector weights on each fund's factsheet. If the same companies head most lists and the US weight is high in all of them, your funds overlap heavily.
Is an S&P 500 fund diversified enough on its own?
It holds 500 large US companies, but on 16 November 2026 the top ten were 36.74% of the SPDR S&P 500 ETF. It gives you no outside-US shares, little in smaller companies and no bonds. Whether that is enough depends on your goals and risk.
What return do I need to double my money in ten years?
About 7.18% a year compounded, after charges. The rule of 72 gives a quick estimate: 72 divided by 7.2 is 10 years.
Can I diversify without moving or merging my accounts?
Yes. Set one target mix for everything you own, then change what each account holds. Narrow-menu accounts can keep the US core while accounts with wide fund choice add the other building blocks.
About Alpesh Patel OBE
Alpesh Patel OBE is Founding Principal of Rootbridge Capital, an author and Dealmaker for the UK Government's Department for Business. He is a former Visiting Fellow in Business, Corpus Christi College, Oxford University, where he worked on technology to improve financial education.
Sources
- State Street Global Advisors, SPDR S&P 500 ETF Trust (opens in a new tab) and daily holdings file (opens in a new tab), 16 November 2026
- S&P Dow Jones Indices, S&P 500 (opens in a new tab)
- MSCI, MSCI World Index factsheet (opens in a new tab), 30 October 2026
- MSCI, MSCI ACWI Index factsheet (opens in a new tab), 30 October 2026
- GOV.UK, Individual Savings Accounts (opens in a new tab)
- GOV.UK, Lump Sum Allowance (opens in a new tab)
- Internal Revenue Service, Roth IRAs (opens in a new tab)
- Alpesh Patel OBE, Global Stock Winners, Losers, and Diversification (opens in a new tab) (YouTube)
Important: This article is for education only and is not personal financial advice or a recommendation to buy or sell any investment. This article is general investment education only and is not regulated investment advice. The value of investments can go down as well as up, and you may get back less than you invest. Past performance is not a reliable indicator of future results.
Important: this article is education and information only. It is not financial advice or a personal recommendation, and it does not take your circumstances into account. The value of investments and pensions can fall as well as rise, and you may get back less than you put in. Past performance is not a reliable indicator of future results. Figures were correct when the article was written and may have changed. If you are unsure what is right for you, speak to a regulated financial adviser.