Gold Miners in Your Portfolio: Why Four Holdings Can Be One Bet
In 2013 the price of gold fell by about 28%. That hurt anyone holding bullion. But the people who really felt it owned gold miners. A widely held gold miners fund lost 53.9% that year, almost twice as much as the metal it is meant to follow, according to VanEck's own filing with the US Securities and Exchange Commission (opens in a new tab).
Now picture an investor who holds gold miners in four places: a gold mining fund, plus three of the biggest gold mining shares bought directly. On the platform screen that looks like four separate holdings. In practice it is one decision taken four times, because all four rise and fall with the same thing: the gold price.
The same portfolio also holds an S&P 500 tracker alongside a handful of large US technology shares. That is a second hidden doubling. The fix for both is simple and old-fashioned: a written maximum weight for every theme, checked on the whole portfolio rather than holding by holding.
Short answer: Holding a gold miners fund plus three big mining shares is not four bets. It is one bet on the gold price, amplified, because miners' profits move more than gold itself. Count every holding by theme, look through your funds, then set a written cap for each theme, such as 10% for gold and gold miners combined.
Not sure how many separate bets your portfolio really holds? Book your free call with Alpesh's team. We will show you how self-directed investors check overlap, size positions and set theme limits they can stick to. There is nothing to buy on the call.
Why do gold miners move more than the gold price?
A gold miner is a business with large, mostly fixed costs: wages, fuel, equipment, royalties and the cost of digging deeper every year. Its revenue moves with the gold price. Its costs mostly do not. So its profit swings by far more than the metal.
Here is an illustrative example. Say a miner's all-in cost is $2,000 an ounce and gold sells for $4,000. The margin is $2,000 an ounce.
- If gold rises 10% to $4,400, the margin rises to $2,400. That is a 20% rise in profit per ounce.
- If gold falls 25% to $3,000, the margin falls to $1,000. Profit per ounce halves.
This is operating leverage. It is why miners can be thrilling in a gold bull market and brutal in a bear market. The share price is effectively a geared bet on gold, before you add the company-specific risks of mines flooding, strikes, political change in the countries where they operate, cost overruns and takeovers.
How far have gold miners fallen in the past?
Further than most investors expect. The chart compares the yearly change in the gold price with a gold miners fund in a few telling years.
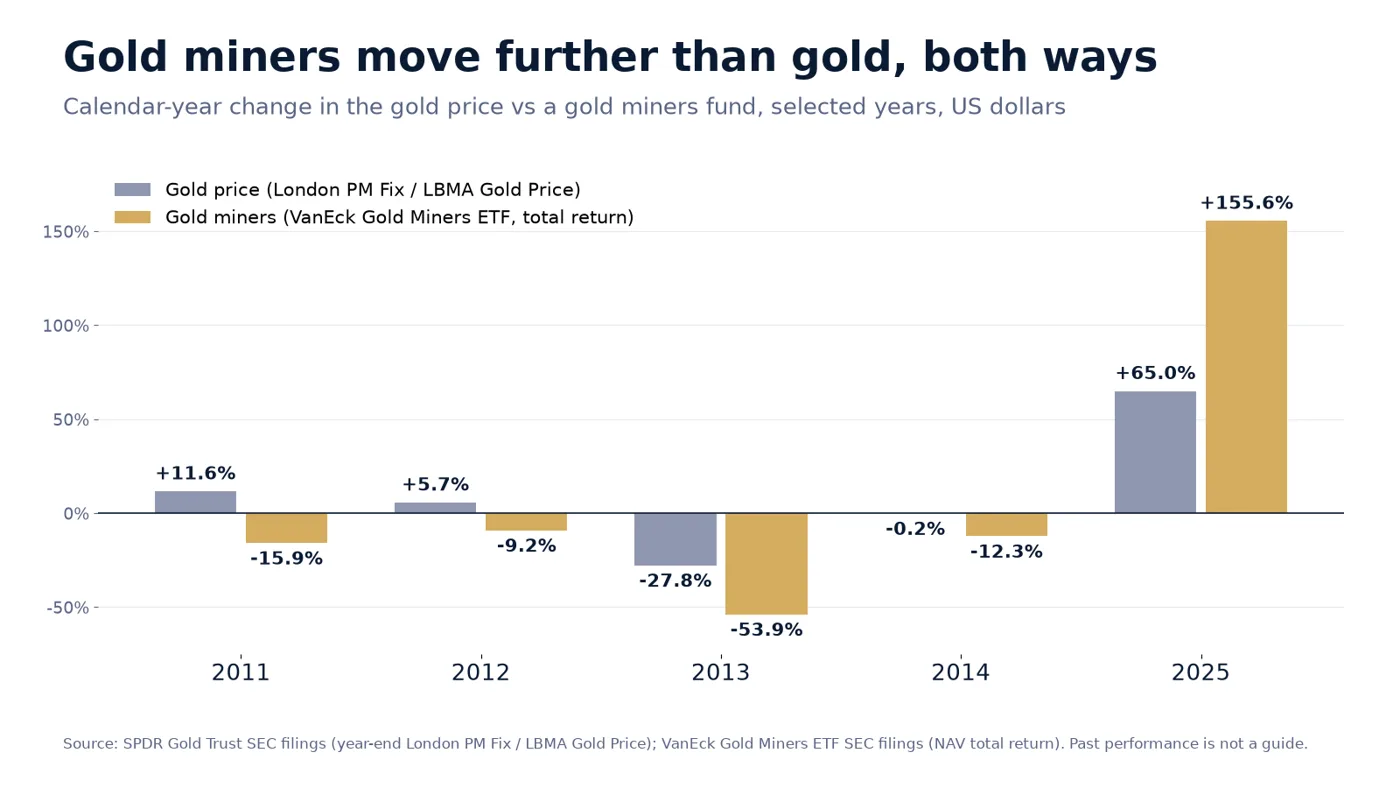
Source: gold price from year-end London PM Fix and LBMA Gold Price figures in SPDR Gold Trust SEC filings (opens in a new tab) (2011 10-K (opens in a new tab), 2025 10-Q (opens in a new tab)); miners from VanEck Gold Miners ETF NAV total returns (opens in a new tab) and its 2026 summary prospectus (opens in a new tab). US dollars.
Three things stand out. Each one matters for how you size a miners position.
Miners can fall while gold rises. In 2011 and 2012 the gold price went up, yet the miners fund lost 15.9% and then 9.2%. Rising costs and investor nerves can outweigh a firmer metal.
The falls compound. Over the four years 2011 to 2014, the fund's yearly returns of −15.93%, −9.16%, −53.90% and −12.31% add up to a loss of about 69%, according to VanEck's SEC filing (opens in a new tab). Over the same years gold fell about 15%, from $1,410.25 at the end of 2010 to $1,199.25 at the end of 2014, based on SPDR Gold Trust filings (opens in a new tab). Gold itself peaked at $1,895.00 on 5 September 2011 (SPDR Gold Trust 10-K (opens in a new tab)) and did not bottom until $1,049.40 on 17 December 2015, a fall of about 45%.
The upside is just as geared. In 2025 gold rose about 65%, from $2,610.85 to $4,307.95 (SPDR Gold Trust 10-Q (opens in a new tab)), and the miners fund returned 155.57% (VanEck summary prospectus (opens in a new tab)). Its worst single quarter in that filing's history was −28.41%, in the second quarter of 2022.
So gold miners can be a reasonable part of a portfolio. But they belong in the "high volatility" bucket, sized like one, not in the "safe haven" bucket because the word gold is in the name. If a 20% swing still feels alarming, my guide to what 20% volatility really means is worth a read first.
Is a gold miners fund plus gold mining shares diversified?
Not much. A gold miners fund already holds the biggest names, and in large amounts. On 31 October 2026 the VanEck Gold Miners UCITS ETF held 59 companies, but its ten largest made up 60.19% of the fund. Newmont was 11.60%, Agnico Eagle 11.25% and Barrick 8.17%, according to VanEck's factsheet (opens in a new tab). Those three alone were 31% of the fund.
So if you also buy those three shares directly, you are not adding three new ideas. You are topping up what the fund already owns. And because every miner's profit is driven by the same metal price, even the smaller names in the fund tend to move together on the big days. Different mines, different countries, one driver.
That matters most when you need diversification to work: in a sharp fall. When gold drops hard, it is rare for one big miner to hold up while the others slide. Four holdings that move as one give you the risk of one large position with the paperwork of four.
How do you check for overlap between funds and shares?
Do a look-through. Take each fund's latest factsheet, multiply its top holdings by the amount you hold in the fund, and add the result to any of the same shares you own directly. Then group everything by theme.
Here is an illustrative portfolio. The weights are made up to show the method; the fund weights come from the factsheet and holdings file cited below.
| Illustrative holding | Headline weight | Look-through: what you really own |
|---|---|---|
| Gold miners fund | 8% | Includes about 2.5% in Newmont, Agnico Eagle and Barrick |
| Newmont, Agnico Eagle, Barrick bought directly | 10% | About 12.5% in these three, once the fund is added |
| Gold and gold miners theme in total | 18% | 18%, all driven by the gold price |
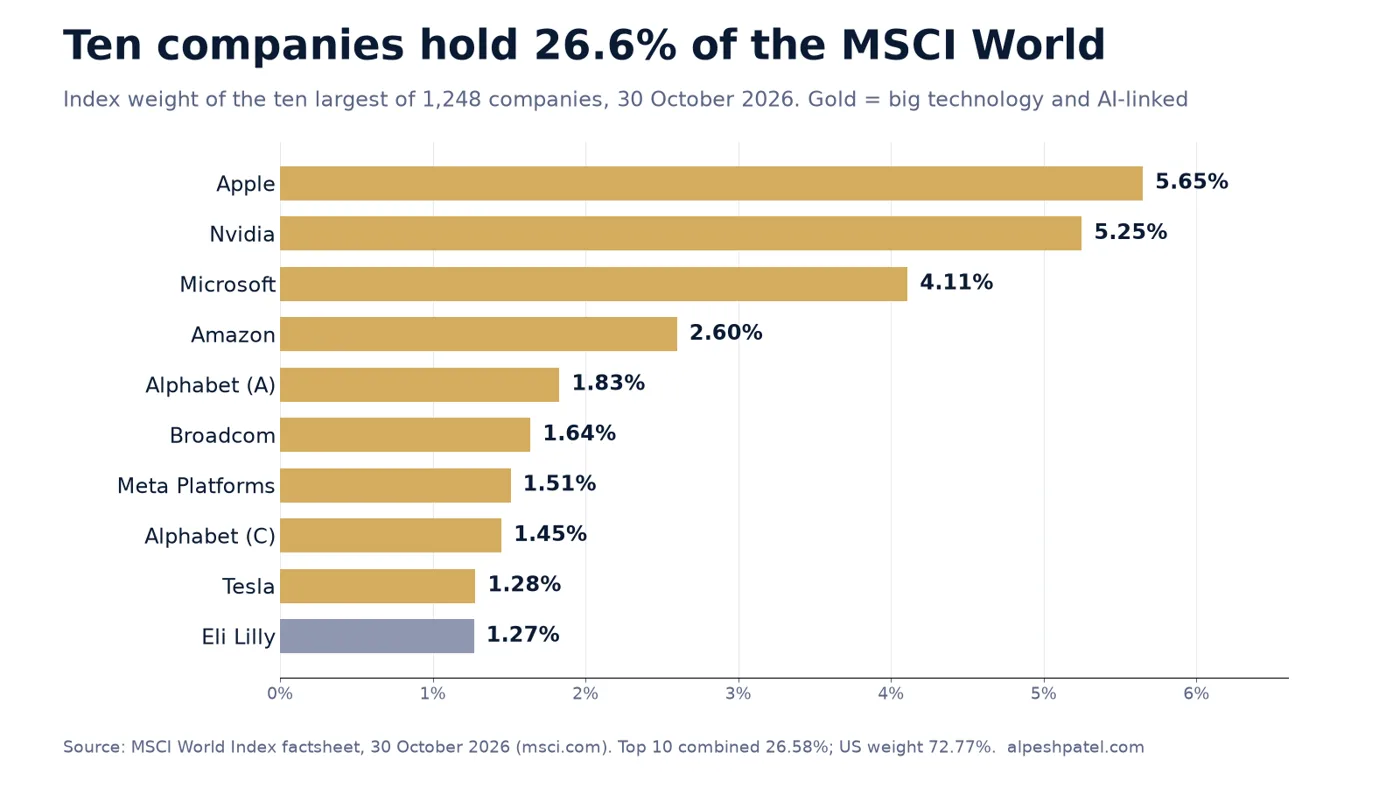
| S&P 500 tracker | 20% | About 7% in Apple, Nvidia, Microsoft, Amazon, Alphabet, Broadcom, Meta and Tesla |
| Apple, Nvidia and Microsoft bought directly | 15% | About 22% in those eight companies, once the tracker is added |
| US big tech theme in total | About 22% | Before counting any global or technology funds |
Illustrative. Gold fund look-through uses the top three weights in the VanEck Gold Miners UCITS ETF factsheet (opens in a new tab) at 31 October 2026 (31.02% combined). S&P 500 look-through uses the State Street SPDR S&P 500 ETF daily holdings file (opens in a new tab) for 17 November 2026, where those eight companies made up 35.05% of the fund.
Two small details from those files are worth noticing. First, an S&P 500 tracker holds a little gold too: Newmont was 0.18% of the SPDR fund on 17 November 2026. Second, the tech overlap is far bigger. Apple alone was 8.10% of the fund that day, Nvidia 5.94% and Microsoft 5.93%.
If you also hold a global tracker or a technology fund, the tech number climbs again, because global indices are heavily weighted to the same US giants. My post on the Magnificent Seven and S&P 500 concentration shows how far that has gone, and too many funds, same index covers overlap across several accounts.
Why does an S&P 500 tracker duplicate your tech shares?
Because the S&P 500 is weighted by company size, and the biggest US companies are technology businesses. When you buy the tracker, you buy them in proportion to their size. When you then buy Apple or Nvidia directly, you are adding to positions you already hold.
That is not wrong in itself. Plenty of investors deliberately hold a core tracker and then tilt towards companies they rate. The problem comes when they do not count the tilt. They think of the tracker as "the diversified bit" and the direct shares as "a few extras", when both are leaning on the same handful of companies.
The mag6 watch page is a quick way to keep an eye on how those few giants are moving.
How do you set a maximum weight per theme?
Write it down before you buy anything, and measure it on the whole portfolio, after look-through. Here is an illustrative set of caps. They are an example of the shape of a rule, not a recommendation for anyone's money.
| Illustrative rule | Example cap | How to measure it |
|---|---|---|
| Any single company | 5% | Direct holding plus look-through from funds |
| Gold and gold miners combined | 10% | Bullion, gold funds, miners funds and mining shares together |
| Any one sector or theme (for example US big tech) | 20% | Direct shares plus look-through from trackers and sector funds |
| Any one high-volatility theme you are adding to | Half the theme cap until it has earned more | Review at each rebalance date |
| Rebalance trigger | 25% above cap | Trim back to the cap, do not wait for a story |
Illustrative only. The right numbers depend on your goals, time horizon and how much of a fall you can live with.
A few practical points make caps work. Without them, a cap is just a number on a page.
Cap the theme, not the ticker. A 5% limit per holding sounds prudent. But four miners at 5% each is 20% in one theme. The theme cap is the one that protects you.
Decide what happens at the cap. A cap with no action attached is a wish. Write the rule: when a theme is 25% above its cap at a review date, trim it back. When it is below, you may add, but only up to the cap.
Use the volatility to size it. A theme that can halve in a year deserves a smaller cap than one that rarely falls 20%. The free Portfolio Odds (opens in a new tab) tool lets you explore how the odds of a loss change with your mix, under its assumptions, and the Probability (opens in a new tab) tool helps you think in ranges rather than single forecasts.
Check once a quarter, not once a day. Look-through takes ten minutes with the latest factsheets. Put it in the diary.
Why managing your own portfolio makes this easier
When you run your own money, you can see every holding and every overlap. Nobody else's model is in the way. You can build the portfolio around your own risk profile: more gold if you want a hedge and accept the swings, less tech if you already earn your living in it.
That control only helps if it comes with a process. Most self-directed investors are good at picking ideas and weak at sizing them and deciding when to sell. A written plan covers three things: what you buy and why, how much of the portfolio each holding and theme may take, and the conditions under which you sell or trim. The pick stocks with a process guide and the protect your portfolio in a crash guide walk through both halves.
What to do next
- List every holding by theme. Put each fund and share under a theme heading: gold, US big tech, UK income, bonds and so on.
- Look through your funds. Use each fund's latest factsheet to add its top holdings to the shares you hold directly.
- Write your caps. Set a maximum for any single company and for each theme, including gold and gold miners combined.
- Decide your trim rule and review dates. For example, trim any theme more than 25% above its cap at each quarterly review.
- Test the mix. Use the free tools on the tools page to see how the portfolio might behave in a bad year before it happens.
Want a written process for sizing themes and deciding when to trim? Book your free call with Alpesh's team. We will show you how self-directed investors pick, size and sell, so a good idea never quietly becomes too big a bet. There is nothing to buy on the call.
Frequently asked questions
Are gold miners a good hedge against a stock market crash?
Not reliably. Gold miners are shares, and in sharp sell-offs they can fall with the wider market even if gold holds up. Their profits are geared to the gold price, so they tend to be more volatile than gold itself.
Why did gold miners fall in 2011 and 2012 when gold went up?
A gold miners fund lost 15.9% in 2011 and 9.2% in 2012 while gold rose, according to VanEck's SEC filing. Rising mining costs, write-downs and investor caution meant profits did not keep pace with the metal.
How much of a portfolio should be in gold miners?
There is no single right number, and this is not a recommendation. Many self-directed investors set a combined cap for gold and gold miners together, often well below their cap for broad equity themes, because of how far miners have fallen in the past.
Does an S&P 500 tracker already hold big tech shares?
Yes. On 17 November 2026 Apple, Nvidia, Microsoft, Amazon, Alphabet, Broadcom, Meta and Tesla made up 35.05% of the State Street SPDR S&P 500 ETF. Buying those shares directly adds to positions the tracker already holds.
How often should I check for overlap?
Quarterly is enough for most investors, and also whenever you add a new fund. Use the latest factsheets and holdings files, because fund weights shift as share prices move.
About Alpesh Patel OBE
Alpesh Patel OBE is Founding Principal of Rootbridge Capital, an author and Dealmaker for the UK Government's Department for Business. He is a former Visiting Fellow in Business, Corpus Christi College, Oxford University, where he worked on technology to improve financial education.
Sources
- VanEck, Market Vectors ETF Trust prospectus (485BPOS, 2015): Gold Miners ETF financial highlights 2010–2014 (opens in a new tab) (SEC)
- VanEck, VanEck Gold Miners ETF summary prospectus, April 2026 (opens in a new tab) (SEC)
- VanEck, VanEck Gold Miners UCITS ETF factsheet, 31 October 2026 (opens in a new tab)
- SPDR Gold Trust, Form 10-K for the year to 30 September 2011 (opens in a new tab) (SEC)
- SPDR Gold Trust, Form 10-Q for the quarter to 31 December 2016 (opens in a new tab) (SEC)
- SPDR Gold Trust, Form 10-Q for the quarter to 31 December 2025 (opens in a new tab) (SEC)
- State Street, SPDR S&P 500 ETF Trust daily holdings file (opens in a new tab)
- Alpesh Patel OBE, Gold Investing Mistakes Everyone Makes! (opens in a new tab) (YouTube)
Important: This article is for education only and is not personal financial advice or a recommendation to buy or sell any investment. This article is general investment education only and is not regulated investment advice. The value of investments can go down as well as up, and you may get back less than you invest. Past performance is not a reliable indicator of future results.
Important: this article is education and information only. It is not financial advice or a personal recommendation, and it does not take your circumstances into account. The value of investments and pensions can fall as well as rise, and you may get back less than you put in. Past performance is not a reliable indicator of future results. Figures were correct when the article was written and may have changed. If you are unsure what is right for you, speak to a regulated financial adviser.