Stock Selection Metrics You Can Check Yourself: A Worked Example Using Microsoft's Annual Report
"Which stock selection metrics can I check myself?" is a question my team hears often from people who already invest but rely on a fund manager or a tip sheet. They want to know whether the numbers behind a company are something an ordinary investor can find and understand, or whether you need a paid terminal.
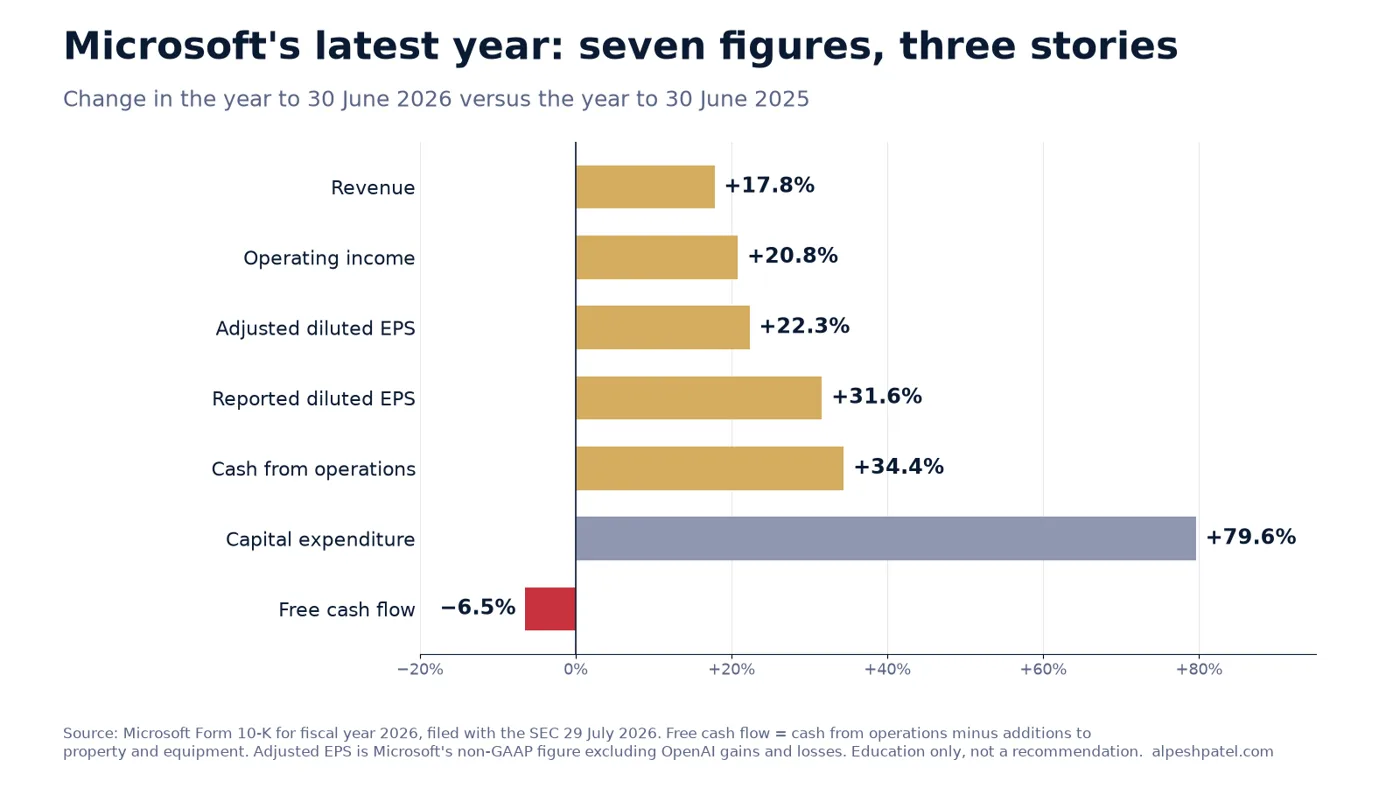
You can do almost all of it free. Microsoft's annual report for the year to 30 June 2026 is a public document, filed with the US Securities and Exchange Commission on 29 July 2026 (Microsoft Form 10-K, SEC (opens in a new tab)). In it, reported earnings per share rose 32%. Yet free cash flow, the cash left after investment, fell by about 6.5%. Same company, same year, two very different stories.
That gap is the point of this guide. I will walk through seven metrics using Microsoft's own published figures, show you where each one lives and how to calculate it, and then show what the numbers cannot tell you. Microsoft is used only because its figures are clean and public. This is education, not a view on whether to buy or sell the shares.
Short answer: You can check the main stock selection metrics yourself from a company's annual report: P/E, earnings growth, return on capital, operating margin, free cash flow, net debt to EBITDA and dividend cover. Each takes a few lines from the income statement, balance sheet or cash flow statement. They describe the past, so use them to screen and question, not to predict.
Want to know how to read a company's numbers for yourself? Book your free call with Alpesh's team. We will show you how self-directed investors screen, check and size their investments with a written process. There is nothing to buy on the call.
Where do you find a company's figures for free?
Every listed company publishes audited accounts. You do not need a subscription to read them.
- The company's investor relations page. Search the company name plus "investor relations". Microsoft's annual reports are on its investor relations site (opens in a new tab).
- US regulatory filings. US companies file an annual report called a Form 10-K with the SEC. You can search every filing free on SEC EDGAR (opens in a new tab).
- UK regulatory filings. UK-listed companies publish annual reports on their own websites, and regulated announcements are stored in the FCA's National Storage Mechanism (opens in a new tab). UK company accounts are also filed at Companies House (opens in a new tab).
Inside the report, three statements matter. The income statement shows revenue, costs and profit. The balance sheet shows what the company owns and owes on one date. The cash flow statement shows the cash that actually came in and went out.
Free data sites and broker platforms also show these ratios. They are useful for screening. But they calculate them in different ways and are sometimes out of date, so check anything important against the report itself.
The seven metrics, worked through on one company
Here are the figures from Microsoft's 10-K for the year to 30 June 2026 (fiscal 2026), in US dollars. Every input is from the filing, except the share price.
| Metric | How to calculate it | Microsoft FY2026 | Where it is in the 10-K |
|---|---|---|---|
| P/E | Share price ÷ diluted EPS | 27.8x | Income statement (EPS) |
| Earnings growth | This year's EPS ÷ last year's − 1 | +31.6% reported, +22.3% adjusted | Income statement; non-GAAP table in Item 7 |
| Return on equity | Net income ÷ average shareholders' equity | 34.0% | Income statement and balance sheet |
| Return on capital employed | Operating income ÷ (total assets − current liabilities) | 26.3% | Income statement and balance sheet |
| Operating margin | Operating income ÷ revenue | 46.8% | Income statement |
| Free cash flow | Cash from operations − capital expenditure | $67.0bn | Cash flow statement |
| Net debt to EBITDA | (Debt − cash) ÷ (operating income + depreciation and amortisation) | Net cash; 0.27x if leases counted as debt | Balance sheet, debt and lease notes, cash flow statement |
| Dividend cover | EPS ÷ dividend per share | 4.9x | Income statement; dividends note |
Source: Microsoft Form 10-K for fiscal year 2026 (opens in a new tab). P/E uses the closing price of $498.30 on 19 November 2026 (Nasdaq, MSFT historical prices (opens in a new tab)). Calculations are mine and use year-end balances unless stated.
P/E ratio: what you pay for the profit
The price-to-earnings ratio divides the share price by earnings per share. Microsoft's diluted EPS for fiscal 2026 was $17.95. At $498.30 a share, that is a P/E of about 27.8. In plain terms, buyers were paying almost 28 years of last year's profit.
Two cautions. Data sites usually show a "trailing" P/E based on the latest four quarters, so their number will differ from one based on the last annual report. And a P/E is only high or low relative to growth, quality and the company's own history.
Earnings growth: reported versus adjusted
Microsoft's diluted EPS rose from $13.64 to $17.95, an increase of 31.6% (10-K (opens in a new tab)). But the filing explains that other income included $6.5 billion of net gains from its investments in OpenAI, mainly a dilution gain, after $4.8 billion of net losses the year before.
Microsoft's own adjusted EPS, which strips those out, rose from $14.13 to $17.28, an increase of 22.3%. Both numbers are honest. They answer different questions, and the difference between them is exactly the kind of thing a quick screen will miss.
Return on capital: how hard the money works
Return on equity divides net income by shareholders' equity. Net income was $133.7 billion and equity averaged about $392.9 billion across the start and end of the year, giving a return on equity of about 34%.
Return on capital employed (ROCE) uses operating income over total assets minus current liabilities, so it includes money from lenders as well as shareholders. Operating income was $155.2 billion. Total assets were $758.4 billion and current liabilities $168.8 billion, giving ROCE of about 26%. I prefer ROCE for comparing companies, because return on equity can be flattered by heavy borrowing.
Operating margin: how much of each sale is profit
Operating margin is operating income divided by revenue. Microsoft's revenue was $331.8 billion, up 17.8%, so its operating margin was about 46.8%, against about 45.6% the year before. That means nearly 47 cents of every dollar of sales was left after the costs of running the business.
Margins are most useful compared over several years and against direct competitors. A rising margin can signal pricing power. A falling one is often the first sign of trouble.
Source: Microsoft Form 10-K for fiscal year 2026. Education only, not a recommendation.
Free cash flow: the number I check first
Free cash flow is cash from operations minus capital expenditure. Microsoft generated $182.9 billion of cash from operations, up 34.4%. But additions to property and equipment, which include data centres and computer systems, jumped 79.6% to $115.9 billion. Free cash flow was therefore about $67.0 billion, down from about $71.6 billion (10-K cash flow statement (opens in a new tab)).
Profit is an accounting opinion. Cash is a fact. When profits rise and free cash flow falls, ask why. Here the answer is a deliberate investment programme, which may or may not pay off. Note too that cash from operations adds back $12.4 billion of stock-based pay, which is a real cost to shareholders even though no cash leaves the company.
Net debt to EBITDA: can the company carry its borrowing?
Net debt is borrowing minus cash. EBITDA is a rough measure of operating cash profit: operating income plus depreciation and amortisation. Dividing one by the other shows roughly how many years of operating profit it would take to repay the debt.
Microsoft's total debt was $40.3 billion against $76.8 billion of cash, cash equivalents and short-term investments, so it had net cash of about $36.5 billion. But the notes show $66.6 billion of finance lease liabilities and $21.9 billion of operating lease liabilities, covering data centres, offices and equipment. Count those as debt and net debt is about $52.0 billion. Against EBITDA of about $193.8 billion (operating income plus the $38.5 billion of "depreciation, amortization, and other" in the cash flow statement), that is about 0.27 times.
Either way the borrowing is small relative to profit. The lesson is that the answer depends on what you count as debt, and a data site may not tell you which choice it made.
Dividend cover: how safe is the dividend?
Dividend cover is EPS divided by the dividend per share. Microsoft declared dividends of $3.64 a share in fiscal 2026, so cover was about 4.9 times reported EPS, or 4.7 times adjusted EPS. My own rule of thumb is to look harder at anything below about 1.5 times, though what is normal varies by industry.
I also check cover against cash. Microsoft paid $26.4 billion in dividends, and free cash flow of $67.0 billion covered that about 2.5 times. That is still comfortable, but noticeably thinner than the earnings figure suggests, because of the jump in investment.
What can't the numbers tell you?
Every figure above describes a year that has already ended. That is their main limit.
The future. The 10-K tells you Microsoft spent $115.9 billion on property and equipment. It cannot tell you what return that spending will earn. A metric is a snapshot, and share prices move on what investors expect next.
Accounting choices. Reported versus adjusted EPS, whether leases count as debt, and whether stock-based pay is treated as a cost all change the answer. The same company can look cheap or expensive depending on which version you use. Always read the definition before you compare.
One-offs. The OpenAI gain lifted reported earnings growth from about 22% to about 32%. One-off gains, write-downs, disposals and restructuring charges can make a single year look much better or worse than the business really is. Look at five years, not one.
Cyclicality. For companies whose profits rise and fall with the economy, such as miners, banks, carmakers and housebuilders, the numbers often look best at the top of the cycle. A low P/E on peak profits can be a trap, because the "E" is about to fall.
What is not in the accounts. Management quality, competition, regulation and technology change do not appear as a line in a 10-K, but they decide whether today's margins last.
How does a written process use these metrics?
Metrics only help if they sit inside a process you follow every time. Mine has four steps, and you can write your own version on one page.
- Screen. Use a few metrics to narrow thousands of companies to a short list. For example, an illustrative quality screen might require ROCE above 15%, positive free cash flow in each of the last five years and net debt below two times EBITDA. My explainer on stock screening tools covers how screens work.
- Check. For each name on the list, read the annual report. Confirm the screen's figures, look for one-offs, read the debt and lease notes and compare five years of margins and cash flow.
- Size. Decide in advance how much of the portfolio one share can be, based on how confident you are and how far it could fall. My guide to position sizing for high-conviction investing explains the limits I use.
- Sell rule. Write down what would make you sell before you buy: for example, the reason you bought no longer holding, a fall in free cash flow two years running, or the position growing beyond its size limit. Illustrative rules only.
This is the case for managing your own money. You control what goes in, you can see every figure behind every holding, and the portfolio is built around your own risk profile rather than a fund's mandate. The free investing tools on this site help with the sums, and the pick stocks with a process guide sets out the steps.
What to do next
- Pick one company you already own and download its latest annual report from its investor relations page, SEC EDGAR or the FCA's National Storage Mechanism.
- Work out the seven metrics yourself using the formulas in the table above, and compare them with what your platform or a data site shows.
- Look for the gaps. Check reported against adjusted earnings, profit against free cash flow, and debt with and without leases.
- Repeat for five years to see whether margins, returns and cash flow are improving or slipping.
- Write your process down: your screen, your checks, your position limits and your sell rules.
Want a written process for picking, sizing and selling shares? Book your free call with Alpesh's team. We will walk through how self-directed investors use company figures to screen, check and size investments, and when they sell. There is nothing to buy on the call.
Frequently asked questions
What are the most important stock selection metrics?
There is no single best one, but return on capital, free cash flow, debt levels and valuation together cover the basics: how profitable the business is, whether profit turns into cash, whether it can carry its borrowing and what you are paying. Use several together rather than relying on one.
Where can I find a company's annual report for free?
On the company's investor relations website. US companies file a Form 10-K on SEC EDGAR, and UK-listed companies' regulated announcements are on the FCA's National Storage Mechanism, with accounts also filed at Companies House.
What is the difference between ROE and ROCE?
Return on equity measures profit against shareholders' money only. Return on capital employed measures operating profit against all long-term funding, including debt, so it is harder for a company to flatter by borrowing more.
Is a low P/E ratio a sign of a cheap share?
Not on its own. A low P/E can reflect slow growth, high risk or profits at a cyclical peak that are about to fall. Compare the P/E with the company's growth, its history and its competitors.
Why can profits rise while free cash flow falls?
Because free cash flow subtracts investment spending, which does not hit profit in the same year. A company spending heavily on new facilities, as Microsoft did in fiscal 2026, can report rising earnings while the cash left over falls.
About Alpesh Patel OBE
Alpesh Patel OBE is Founding Principal of Rootbridge Capital, an author and Dealmaker for the UK Government's Department for Business. He is a former Visiting Fellow in Business, Corpus Christi College, Oxford University, where he worked on technology to improve financial education.
Sources
- Microsoft, Form 10-K for the fiscal year ended 30 June 2026 (opens in a new tab), filed with the SEC 29 July 2026
- Microsoft, Investor relations: annual reports (opens in a new tab)
- Nasdaq, MSFT historical prices (opens in a new tab)
- US Securities and Exchange Commission, EDGAR full-text search (opens in a new tab)
- Financial Conduct Authority, National Storage Mechanism (opens in a new tab)
- Companies House, Find and update company information (opens in a new tab)
Important: This article is for education only and is not personal financial advice or a recommendation to buy or sell any investment. This article is general investment education only and is not regulated investment advice. The value of investments can go down as well as up, and you may get back less than you invest. Past performance is not a reliable indicator of future results.
Important: this article is education and information only. It is not financial advice or a personal recommendation, and it does not take your circumstances into account. The value of investments and pensions can fall as well as rise, and you may get back less than you put in. Past performance is not a reliable indicator of future results. Figures were correct when the article was written and may have changed. If you are unsure what is right for you, speak to a regulated financial adviser.