American Funds Review: When Your 'Loss' Is Really the Gap to the Market
Some of the most frustrated investors I speak to have not actually lost money. Their account is up. Yet when they finally line it up against the market, they realise they have quietly fallen behind, year after year, and they feel they have lost something. They are right.
This American Funds review looks at that feeling. Capital Group's American Funds are among the best-known names in US investing, with long records and respected managers. That is precisely why they make a useful case study. If even a strong brand can leave you behind the index once charges are counted, the issue is not one bad fund. It is the way the fund was chosen and paid for.
The good news is that the fix does not involve taking more risk. It involves a written selection rule, and the discipline to keep to it.
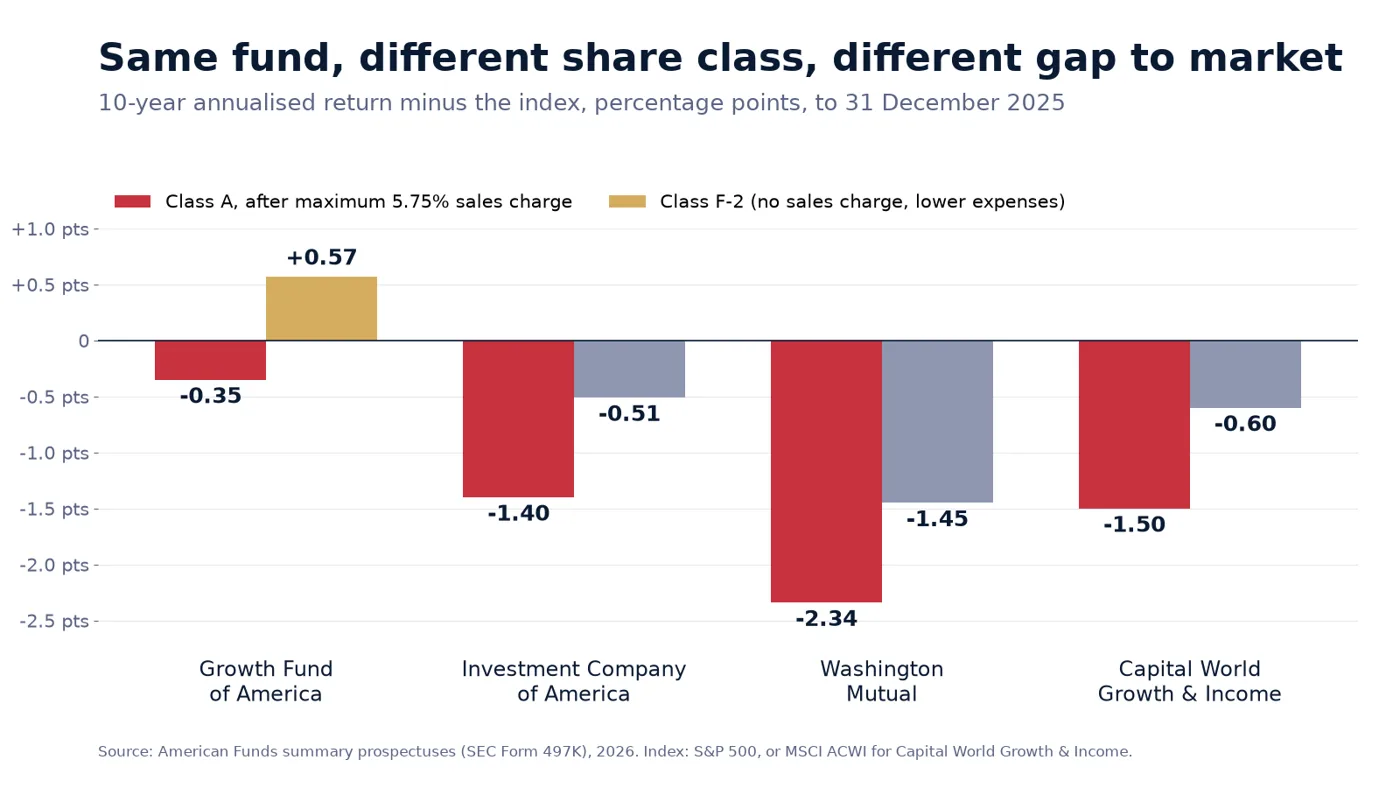
Short answer: Over the ten years to 31 December 2025, the Class A shares of four flagship American Funds trailed their index by 0.35 to 2.34 percentage points a year after the maximum 5.75% sales charge. The cheaper F-2 shares of the same funds did noticeably better. Much of the "loss" was the share class, not the market.
Wondering whether your funds are keeping up with the market once charges are counted? Book your free call with Alpesh's team. We will walk through how self-directed investors choose, size and review their investments. There is nothing to buy on the call.
What are American Funds and how are they sold?
American Funds is the US mutual fund range of Capital Group. Most are sold through financial advisers and brokers, and each fund comes in many share classes. The investments inside are the same; what changes is how you pay.
Class A shares carry an up-front sales charge, or front-end load. For Capital Group's equity, balanced and target date funds, the share class pricing page (opens in a new tab) shows the charge starts at 5.75% on purchases under $25,000 and steps down to 3.50% at $100,000, 2.50% at $250,000 and zero at $1 million and above. A prospectus such as AMCAP Fund's (opens in a new tab) shows that, at the top rate, 5.00 percentage points of the 5.75% go to the selling dealer.
There is a second layer too. The Growth Fund of America summary prospectus (opens in a new tab) shows that even purchases of $1 million or more made without a sales charge can face a 1% deferred charge if sold within 18 months. Then come yearly expenses, which for Class A include a distribution (12b-1) fee.
UK readers more often meet Capital Group through its Luxembourg-domiciled funds. For example, Fidelity's factsheet (opens in a new tab) for Capital Group New Perspective Fund (LUX) Class Z lists an ongoing charge of 0.84% plus transaction costs of 0.08%, against an MSCI ACWI comparison index. The same questions in this article apply to those funds.
How have flagship American Funds done against the index?
Each American Fund's summary prospectus, filed with the SEC as Form 497K, shows ten-year returns for Class A after the maximum sales charge, and for other classes, next to a benchmark. Here are four flagships, all to 31 December 2025.
| Fund | Class A yearly expenses | Class A 10-yr return (after max sales charge) | Class F-2 10-yr return | Index 10-yr return |
|---|---|---|---|---|
| Growth Fund of America (opens in a new tab) | 0.58% | 14.47% | 15.39% | S&P 500: 14.82% |
| Investment Company of America (opens in a new tab) | 0.55% | 13.42% | 14.31% | S&P 500: 14.82% |
| Washington Mutual (opens in a new tab) | 0.55% | 12.48% | 13.37% | S&P 500: 14.82% |
| Capital World Growth and Income (opens in a new tab) | 0.73% | 10.22% | 11.12% | MSCI ACWI: 11.72% |
Returns are annualised. The index figures reflect no fees, so they are not something you could have earned exactly, but a low-cost index fund would have come close.
Source: American Funds summary prospectuses (SEC Form 497K), 2026.
The pattern is consistent. In every case the F-2 shares, which carry no sales charge and lower expenses, beat the Class A shares of the same fund by around 0.9 percentage points a year over ten years. For Growth Fund of America, that was the difference between beating the S&P 500 and trailing it.
What does the gap to the market cost in money?
Percentages hide the scale, so here is an illustrative example using the published ten-year figures. It is not a forecast.
Put $100,000 in at the start of 2016. Growing at the S&P 500's 14.82% a year, it becomes about $398,000 after ten years. At Investment Company of America's Class A return of 13.42%, it becomes about $352,000. The gap is roughly $46,000, on a fund that was up more than 250%.
That is what I mean by a "loss" that is really the gap to the market. Nothing went wrong in the headline sense. The account just grew more slowly than the simple alternative, and the charges did a lot of that work.
Costs are spelled out in each prospectus if you know where to look. The Investment Company of America summary prospectus (opens in a new tab) estimates the cost of investing $10,000 for ten years, assuming 5% growth, at $1,225 for Class A against $468 for Class F-2. Same fund, same managers, about two and a half times the cost.
Do most active funds beat the S&P 500?
No, and the evidence is long-running. S&P Dow Jones Indices' SPIVA US Year-End 2025 scorecard (opens in a new tab) found that 79% of active large-cap US equity funds underperformed the S&P 500 in 2025, up from 65% in 2024. The full report (opens in a new tab) puts the share at 85.59% over ten years, 89.93% over 15 years and 92.89% over 20 years.
The first half of 2026 was kinder: the SPIVA US Mid-Year 2026 report (opens in a new tab) says 67% of active large-cap funds lagged. Even then, two in three trailed.
Picking the winners in advance is also harder than it looks. S&P's US Persistence Scorecard (opens in a new tab) found that only 4.5% of large-cap funds stayed in the top half of their peer group across five consecutive years. A strong past record, on its own, is a weak guide.
Is Growth Fund of America a riskier ride than the index?
Partly, yes. Capital Group's own Growth Fund of America page (opens in a new tab) shows a ten-year beta of 1.07 against the S&P 500, with downside capture of 109% and upside capture of 106%. In plain terms, it has tended to fall a little further than the market in bad months and rise a little further in good ones.
That showed in 2022. Fidelity's performance data (opens in a new tab) for the Class A shares shows a loss of 30.72% that year against 18.11% for the S&P 500. Investors who sold after a year like that locked in the gap.
That matters because behaviour widens the gap further. Morningstar's Mind the Gap 2026 study (opens in a new tab) found the average dollar invested in US funds earned 8.7% a year over the ten years to 31 December 2025, against 9.9% for the funds themselves. Poorly timed buying and selling cost investors about 1.2 percentage points a year, on top of any charges.
How do you fix it without taking more risk?
You do not need a more aggressive portfolio to close a charges gap. You need a rule that stops you paying for things that do not help, and the discipline to keep to it when a salesperson or a bad year tempts you off course.
Here is an illustrative written selection rule. It is an example of the shape, not a recommendation for you.
- I compare every fund with the index it names in its own prospectus, after all charges, over at least five and ten years.
- I do not buy share classes with a sales charge where a no-load class or a low-cost index fund gives me the same exposure.
- I write down the most I will pay each year in total costs, including platform or adviser fees.
- I decide in advance how much goes in each holding, and when I will rebalance.
- I review once a year. I only switch if a fund trails its index by a set margin over five years, after costs and tax.
Rule five matters. In a US taxable account, selling a fund can trigger capital gains tax, and loads already paid are sunk costs. If you are a US person living in the UK, or a UK resident holding US funds, the tax treatment can be complex, and a cross-border tax specialist should confirm the position before you move anything.
This is how I manage my own money: a written process for what to pick, how much to hold and when to sell or rebalance. It gives control, transparency and a portfolio built around my own risk profile. I have written more on why "just buy the index" is not a process on its own, on S&P 500 concentration and on owning too many funds that track the same thing.
What to do next
- Find the exact share class you own (the letter after the fund name) and its ticker.
- Open the fund's latest summary prospectus and note the sales charge you paid, yearly expenses and the ten-year return against its index.
- Add any adviser or platform fee on top, and work out your total yearly cost.
- Write your own selection rule, in five lines or fewer, before you change anything.
- Test the plan with the portfolio odds tool (opens in a new tab) or the probability calculator (opens in a new tab), and see the other free tools.
If you work with an adviser, the review your adviser and cut fees and charges pages are useful starting points.
Want to see how a written selection rule works in practice? Book your free call with Alpesh's team. We will show you how self-directed investors pick, size and review their holdings with a clear process. There is nothing to buy on the call.
Frequently asked questions
Are American Funds bad funds?
Not as a rule. Several have long records and Growth Fund of America's F-2 shares beat the S&P 500 over the ten years to the end of 2025. The problem in this review is the share class and the charges, which can turn a decent fund into a below-index result.
What is the sales charge on American Funds Class A shares?
For Capital Group's equity funds, the maximum Class A sales charge is 5.75% on purchases under $25,000. It falls in steps as the amount rises and reaches zero at $1 million, though a 1% deferred charge can then apply if you sell within 18 months.
Should I sell my Class A shares and switch?
Not automatically. The sales charge is already paid, so the question is whether future yearly costs and expected returns justify staying, after any tax on selling. Ask a tax specialist to confirm the tax position before you move money.
Do UK investors buy American Funds?
UK investors more often meet Capital Group through its Luxembourg-domiciled versions, such as New Perspective Fund (LUX), which UK platforms list. Those funds have their own charges and share classes to check, using the same questions as above.
About Alpesh Patel OBE
Alpesh Patel OBE is Founding Principal of Rootbridge Capital, an author and Dealmaker for the UK Government's Department for Business. He is a former Visiting Fellow in Business, Corpus Christi College, Oxford University, where he worked on technology to improve financial education.
Sources
- Capital Group, share class pricing and breakpoints (opens in a new tab)
- AMCAP Fund prospectus, sales charge and dealer commission table (SEC) (opens in a new tab)
- Growth Fund of America summary prospectus, 497K (SEC) (opens in a new tab)
- Investment Company of America summary prospectus, 497K (SEC) (opens in a new tab)
- Washington Mutual Investors Fund summary prospectus, 497K (SEC) (opens in a new tab)
- Capital World Growth and Income Fund summary prospectus, 497K (SEC) (opens in a new tab)
- Capital Group, Growth Fund of America fund page (opens in a new tab)
- Fidelity, Growth Fund of America performance (opens in a new tab)
- Fidelity UK, Capital Group New Perspective Fund (LUX) Z factsheet (opens in a new tab)
- S&P Dow Jones Indices, SPIVA US Year-End 2025 (opens in a new tab)
- SPIVA US Year-End 2025 full report (PDF) (opens in a new tab)
- S&P Dow Jones Indices, SPIVA US Mid-Year 2026 (opens in a new tab)
- S&P Dow Jones Indices, US Persistence Scorecard (opens in a new tab)
- Morningstar, Mind the Gap 2026 (opens in a new tab)
- YouTube: Pension Underperformance | The Brand Name Trap (opens in a new tab)
Important: This article is for education only and is not personal financial advice or a recommendation to buy or sell any investment. This article is general investment education only and is not regulated investment advice. The value of investments can go down as well as up, and you may get back less than you invest. Past performance is not a reliable indicator of future results.
Important: this article is education and information only. It is not financial advice or a personal recommendation, and it does not take your circumstances into account. The value of investments and pensions can fall as well as rise, and you may get back less than you put in. Past performance is not a reliable indicator of future results. Figures were correct when the article was written and may have changed. If you are unsure what is right for you, speak to a regulated financial adviser.