Artemis Global Income Fund Review: Can You Live Off the Dividends?
In 2025 the Artemis Global Income Fund returned 45.1%. The average fund in its peer group, the IA Global Equity Income sector, returned 12.8%. Trustnet (opens in a new tab) Over the ten years to 30 June 2026 it more than quadrupled investors' money. Artemis factsheet, 30 June 2026 (opens in a new tab)
Here is the surprise for anyone planning to retire on it. Despite "Income" in the name, its historic yield was 2.38% at 30 September 2026. Artemis (opens in a new tab) On a £500,000 pot that is roughly £11,900 a year in dividends, before tax and before any pension or platform charge.
So this Artemis Global Income Fund review asks two questions. How good has the fund actually been, once risk and cost are counted? And can a retiree live off its dividends, or is total return the number that matters?
Short answer: Artemis Global Income has been one of the strongest global equity income funds over three, five and ten years, beating both its sector and the MSCI AC World index. But it yields only about 2.4%, carries more risk than the market and costs 0.825% a year before wrapper charges. For most retirees, total return and a withdrawal plan matter more than the dividend alone.
Wondering whether a fund like this fits your retirement income plan? Book your free call with Alpesh's team. We will walk through how self-directed investors choose, size and review their investments. There is nothing to buy on the call.
What is the Artemis Global Income Fund?
It is a UK unit trust launched on 19 July 2010 by Artemis Fund Managers. Its objective is to grow both income and capital over five years. It must hold 80% to 100% in company shares, anywhere in the world and in any industry. Artemis (opens in a new tab)
The fund is large, at £6.62 billion on Artemis's own fund page. Artemis (opens in a new tab) It is compared against two yardsticks: the MSCI AC World index of global shares and the IA Global Equity Income sector of rival funds. It is not required to track either.
Who runs it?
Jacob de Tusch-Lec has managed the fund since launch, more than 16 years. He has also run Artemis's Global Value strategy since March 2026. Artemis (opens in a new tab) James Davidson, who joined Artemis in 2018, has been co-manager since April 2020. Trustnet (opens in a new tab)
Long tenure is worth noting. The record below belongs largely to one lead manager, so the question of key-person risk is a fair one to keep in mind.
What does it cost?
The ongoing charge figure (OCF) is 0.825% a year for the I units and 1.575% for the older R units. Artemis (opens in a new tab) Most investment platforms offer the I units. On top of the OCF, Fidelity lists transaction costs of 0.53% a year, the cost of the fund's own trading. Fidelity (opens in a new tab)
How has Artemis Global Income performed?
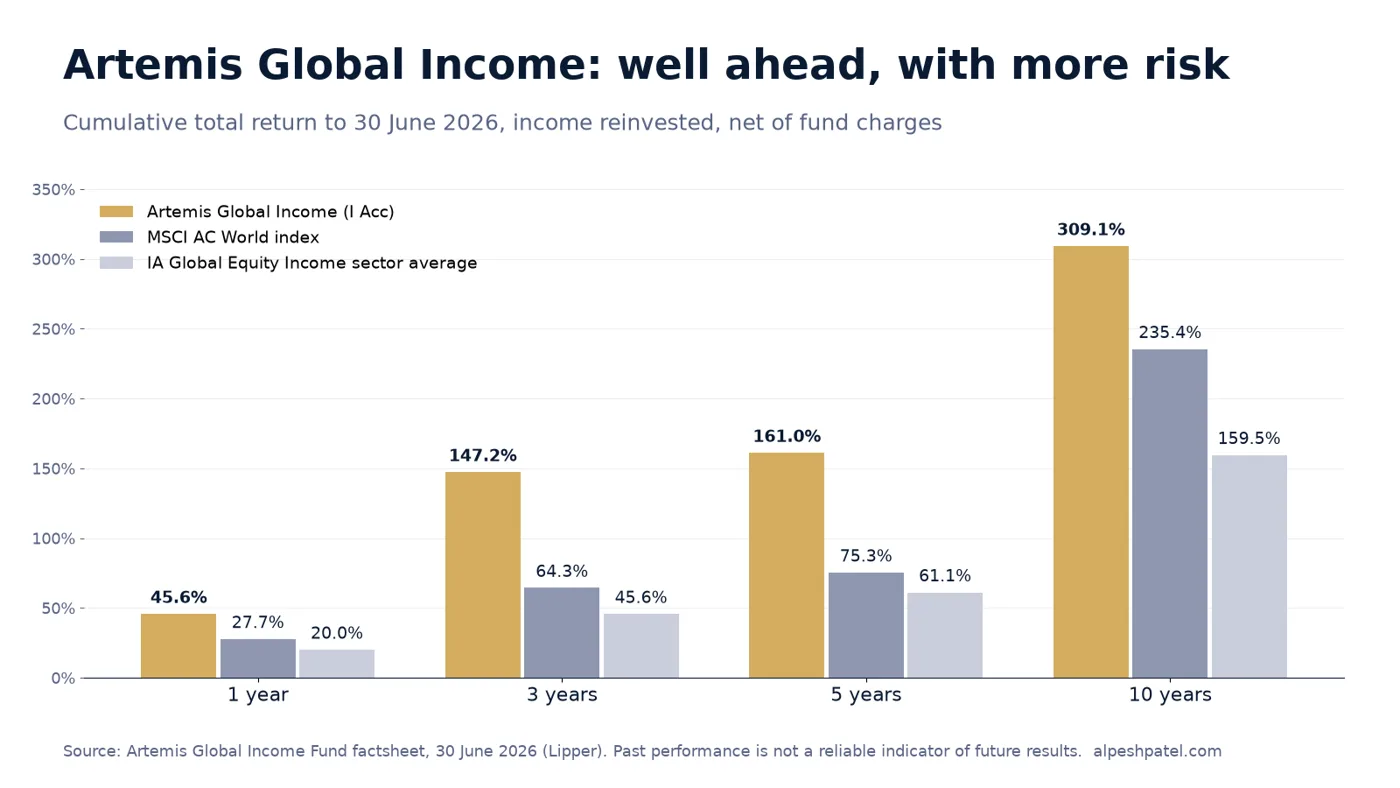
Strongly. The table uses Artemis's own factsheet so every figure is to the same date and on the same basis.
| Cumulative total return to 30 June 2026 | 1 year | 3 years | 5 years | 10 years |
|---|---|---|---|---|
| Artemis Global Income (I Acc) | 45.6% | 147.2% | 161.0% | 309.1% |
| MSCI AC World index | 27.7% | 64.3% | 75.3% | 235.4% |
| IA Global Equity Income sector | 20.0% | 45.6% | 61.1% | 159.5% |
Source: Artemis Global Income Fund factsheet, 30 June 2026 (opens in a new tab) (Lipper, income reinvested, net of fund charges). Past performance is not a reliable indicator of future results.
Source: Artemis Global Income Fund factsheet, 30 June 2026.
FE fundinfo data put the fund's annualised return at 14.2% a year over the ten years to 30 September 2026, against 9.1% for the sector, ranking it first of 36 funds. FE fundinfo factsheet (opens in a new tab) On those figures, £100,000 grew to about £378,000 in the fund and about £239,000 in the average rival.
The record is not a straight line
It has not all been one way. In the year to 30 September 2019 the fund lost 5.83% while the peer-group average shown by Fidelity gained 6.32%, and it fell a further 9.17% the following year. Fidelity (opens in a new tab) Most of the outperformance came from 2021 onwards.
The recent past is also a reminder. In the three months to 17 November 2026 the fund fell 6.4% while the sector rose 1.1%, putting it 54th of 55. Trustnet (opens in a new tab) A fund that can beat its peers by 30 points in a year can also trail them sharply in a quarter.
What does the fund own?
At 30 September 2026 the fund held 93 companies. The ten largest were Accenture (3.9%), Cisco Systems (2.9%), Banca MPS (2.7%), Standard Chartered (2.4%), Samsung Electronics (2.3%), Japan Post Holdings (2.3%), Hanwha Aerospace (2.2%), Vår Energi (2.2%), Bank of Nova Scotia (2.0%) and Samsung Life Insurance (1.9%). Artemis (opens in a new tab)
The shape is very different from a global index:
- Regions: North America 32.7%, Europe 30.5%, emerging markets 24.5%, Japan 8.0%, Asia Pacific ex Japan 2.4%.
- Sectors: financials 38.8%, information technology 16.7%, industrials 12.7%, energy 12.4%, materials 6.9%, health care 3.9%.
Source: Artemis (opens in a new tab), as at 30 September 2026.
This is a value and income fund with a contrarian streak. Artemis describes a "strong bias towards attractively valued company shares often not held by similar funds". Artemis (opens in a new tab) On 1 October 2026 its holdings traded on 12.9 times earnings against 20.7 times for the MSCI AC World index, with a dividend yield of 3.7% against 1.8%. Artemis Q3 2026 update (opens in a new tab)
Note the gap between that 3.7% and the 2.38% the fund actually paid investors over the past year. The first is the current yield on the shares it holds; the second is twelve months of distributions measured against a price that has risen fast.
How risky is it?
The fund sits at 5 on the 1-to-7 risk and reward scale in its Key Investor Information Document, as at 31 January 2026. Artemis KIID (opens in a new tab) That is the band for a typical share fund, not a cautious one.
Over three years its volatility was 13.58% and its beta 1.25, meaning it has tended to move about a quarter more than the market in either direction. Trustnet (opens in a new tab) Square Mile reports a maximum drawdown of 9.39% over the three years to 31 October 2026, a short and unusually kind period for markets. Square Mile (opens in a new tab)
The big bets add their own risks. Almost a quarter of the fund is in emerging markets, and nearly two-fifths in financials. A banking scare or an emerging-market sell-off would hit it harder than a global index.
Can you live off the dividends from Artemis Global Income?
For most people, not on their own. The fund pays income twice a year, on 31 March and 30 September. For the 2025/26 year the I income units paid 2.0986p in March and 3.7064p in September, 5.805p in total. Artemis (opens in a new tab)
At the 2.38% historic yield, an illustrative £500,000 would have produced about £11,900 a year. A retiree who needs £25,000 a year from the pot would be less than halfway there. Artemis is also clear that "the payment of income and its level is not guaranteed". Artemis (opens in a new tab)
Income yield vs total return
The better question is what the money earns in total: dividends plus growth. A fund that yields 2.4% but grows strongly can fund a higher withdrawal than one yielding 5% that shrinks. What matters is a sustainable withdrawal rate, a cash buffer for bad years and a rule for which holdings to sell.
That is also why the fund's charges matter. Artemis warns that where charges are taken from capital, "distributable income may be increased at the expense of capital". Artemis (opens in a new tab) A higher income figure can come at the cost of future growth.
Inside a pension you do not receive the dividends
Many savers hold this fund through a pension rather than directly. The Aviva Pensions Artemis Global Income S6 version, for example, is an accumulation fund, so dividends are reinvested rather than paid out. Trustnet lists its total expense ratio at 0.87%. Trustnet (opens in a new tab) Aviva's workplace fund guide describes 0.87% as a "total additional yearly charge", on top of your plan's own charge. Aviva (opens in a new tab)
In a pension, "living off the dividends" really means drawing an income from the pot. The yield is just one input to that plan.
What does it cost on a £500,000 pot over 10 and 20 years?
The table below is illustrative. It assumes £500,000, a 5% a year return before charges, charges taken at the end of each year and no withdrawals. It excludes transaction costs, dealing charges and tax. Real returns will vary.
| Illustrative example, £500,000 | Annual charge | Charges in year one | Total charges, 10 years | Total charges, 20 years | Pot after 20 years |
|---|---|---|---|---|---|
| Artemis Global Income I (0.825%) in an AJ Bell SIPP | 0.825% + tiered platform fee | £5,206 | £60,694 | £146,412 | £1,097,667 |
| Artemis Global Income I (0.825%) plus an assumed 1% wrapper and advice fee | 1.825% | £9,581 | £110,263 | £259,656 | £917,855 |
| Global index fund (0.23%) in Vanguard Personal Pension | 0.23% + £375 cap | £1,582 | £18,721 | £46,190 | £1,254,850 |
Charges: Artemis (opens in a new tab) (OCF); AJ Bell (opens in a new tab) (0.25% on the first £250,000, 0.10% on the next £250,000, nil above, plus £1.50 a fund deal); Vanguard Personal Pension (opens in a new tab) (0.15% capped at £375); Vanguard FTSE Global All Cap Index Fund (opens in a new tab) (0.23% OCF). The 1% wrapper and advice fee is an assumption for illustration, not any provider's quoted price. Check your own statement.
The same 5% is assumed for every row to isolate the cost. In reality an active fund like this one aims to earn its higher fee by beating the index, and over the past ten years it has. The point is to know the price you are paying in pounds, and to ask each year whether the extra return is still coming through.
How much does the investor see and decide?
In a single active fund, the manager decides almost everything: which 93 companies to own, how much in banks, how much in emerging markets and when to sell. You see a top ten and a monthly factsheet, not every trade.
That is the trade-off of handing over the decisions. Someone else does the work, and a skilled manager can add a great deal. But you cannot shape the portfolio around your own spending dates, your other pensions or how much a fall you can stomach.
When you manage your own money, the deal flips. You give up having someone do it for you. In exchange you get control, transparency, with every holding and every charge visible, and a portfolio built for your own risk profile. It can be done, provided you have a written process for choosing, sizing and selling. My guides to income and dividend investing and running your own SIPP set out the steps.
Before you move a pension: the checks
If reading this has you thinking about moving an old pension that holds the fund, check the following first.
Ask in writing what you would lose. Guarantees, guaranteed annuity rates, protected tax-free cash or a protected pension age, loyalty bonuses, death benefits and exit fees. My Aviva pension fund review covers the questions to ask.
Know the advice rule. If you have safeguarded benefits, such as a final-salary pension, worth more than £30,000, the law requires you to take advice from an FCA-authorised adviser before transferring them. FCA (opens in a new tab)
Watch for scams. Action Fraud figures cited by The Pensions Regulator show £17.7 million was reported lost to pension fraud in 2023, an average of nearly £47,000 per person, and fewer than one in five scams are thought to be reported. The Pensions Regulator (opens in a new tab) Be wary of cold calls, "free pension reviews" and promises of guaranteed returns.
What to do next
- Find your exact version and charge. Your statement shows whether you hold the I, R or C units, or a pension version, and the full charge including any wrapper.
- Work out your income need. Use the free Pension Plan (opens in a new tab) tool, the FIRE calculator (opens in a new tab) and the build a retirement income guide to see what the pot must pay each year.
- Test the risk. Portfolio Odds (opens in a new tab) lets you explore the chance of a loss for a given mix. More free tools are on the tools page.
- Price it in pounds. Compare your total cost with a lower-cost platform; my guide to the cheapest SIPP for drawdown does this for five platforms.
- Write down your process. What would make you add, trim or sell this fund? Decide before markets force the question.
Want a process for turning a pot into a retirement income you control? Book your free call with Alpesh's team. We will show you how self-directed investors choose a mix, size positions and decide when to sell, so the control you gain is matched by a plan you can stick to.
Frequently asked questions
Is Artemis Global Income a good fund?
On its record, it has been one of the strongest in its sector, ranking first of 36 funds over ten years to 30 September 2026 on FE fundinfo data. It has also had weak spells, and it carries more risk than a global index. Whether it suits you depends on your plan, not its past.
What is the yield on Artemis Global Income?
The historic yield was 2.38% at 30 September 2026, according to Artemis. Income is paid twice a year, on 31 March and 30 September, and is not guaranteed.
Who manages Artemis Global Income?
Jacob de Tusch-Lec has managed it since launch in July 2010, with James Davidson as co-manager since April 2020.
What are the charges on Artemis Global Income?
The OCF is 0.825% for I units, 1.275% for C units and 1.575% for R units. Transaction costs, platform fees and any pension wrapper or adviser charges come on top.
Can I live off dividends in retirement?
Few people can on dividends alone. At a 2.4% yield, £500,000 produces about £12,000 a year. Most retirees need a total-return plan that combines income with planned withdrawals from growth.
About Alpesh Patel OBE
Alpesh Patel OBE is Founding Principal of Rootbridge Capital, an author and Dealmaker for the UK Government's Department for Business. He is a former Visiting Fellow in Business, Corpus Christi College, Oxford University, where he worked on technology to improve financial education.
Sources
- Artemis, Artemis Global Income Fund (opens in a new tab): fund size, yield, distributions, OCF, holdings, regions and sectors, as at 30 September 2026
- Artemis, Jacob de Tusch-Lec (opens in a new tab)
- Artemis, Global Income Fund factsheet, 30 June 2026 (opens in a new tab)
- Artemis, Global Income Fund Q3 2026 update (opens in a new tab)
- Artemis, Key Investor Information, I Acc (opens in a new tab)
- FE fundinfo, Artemis Global Income I Acc factsheet, 30 September 2026 (opens in a new tab)
- Trustnet, Artemis Global Income I Acc (opens in a new tab) and I Inc (opens in a new tab)
- Trustnet, Aviva Pen Artemis Global Income Pn S6 (opens in a new tab)
- Aviva, Your fund selection (workplace) (opens in a new tab)
- Fidelity, Artemis Global Income I Acc key statistics (opens in a new tab) and performance (opens in a new tab)
- Square Mile, Artemis Global Income I Inc (opens in a new tab)
- AJ Bell, SIPP charges and rates (opens in a new tab)
- Vanguard, Personal Pension (opens in a new tab) and FTSE Global All Cap Index Fund (opens in a new tab)
- Financial Conduct Authority, Advising on pension transfers: our expectations (opens in a new tab)
- The Pensions Regulator, Working together to strengthen our defences against scams (opens in a new tab)
- Alpesh Patel OBE, Why Passive Income With Dividends Doesn't Work (opens in a new tab) (YouTube)
Important: This article is for education only and is not personal financial advice or a recommendation to buy or sell any investment. This article is general investment education only and is not regulated investment advice. The value of investments can go down as well as up, and you may get back less than you invest. Past performance is not a reliable indicator of future results.
Important: this article is education and information only. It is not financial advice or a personal recommendation, and it does not take your circumstances into account. The value of investments and pensions can fall as well as rise, and you may get back less than you put in. Past performance is not a reliable indicator of future results. Figures were correct when the article was written and may have changed. If you are unsure what is right for you, speak to a regulated financial adviser.