Discretionary Fund Manager Review: Why Your Balanced Portfolio Lags the Index
Picture someone in their late fifties with a seven-figure portfolio split between two well-known discretionary managers. Each quarter a glossy report arrives. Both say "balanced". Both show positive numbers most years. Nothing looks wrong, so nobody asks the obvious question: what would a simple balanced index have done with the same money?
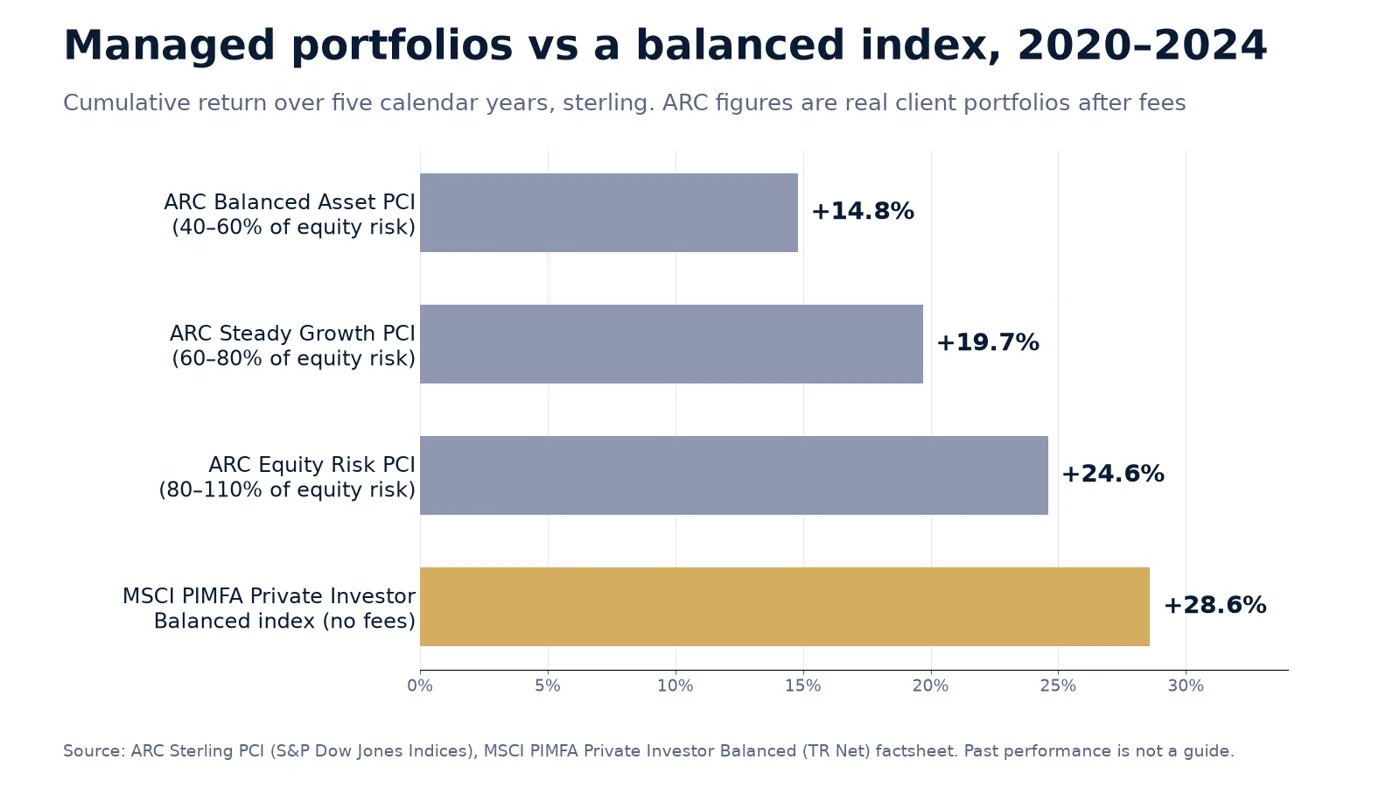
A proper discretionary fund manager review starts with that question, and the answer is often uncomfortable. Over the five calendar years 2020 to 2024, the average real client portfolio in the ARC Sterling Balanced Asset index returned about 14.8% in total, after fees. The MSCI PIMFA Private Investor Balanced index, a published benchmark built from market indices, returned about 28.6%. Even the riskiest ARC category, Equity Risk, returned about 24.6%. S&P Dow Jones Indices ARC Sterling PCI report (opens in a new tab), MSCI PIMFA factsheet (opens in a new tab)
That gap is not proof that any one manager is poor. Some beat their peers, and an index has no costs at all. But it explains why so many people who pay for a managed "balanced" portfolio feel their money has been treading water while the headlines talk about record markets.
Short answer: Managed balanced portfolios often lag the index because fees of around 1% to 2% a year come out every year, most active managers underperform their benchmarks over long periods, and "balanced" portfolios often hold less in shares than the index they are compared with. Check your total cost in pounds and compare your returns with a matched index.
Wondering whether your discretionary manager is earning its fee? Book your free call with Alpesh's team. We will show you how self-directed investors compare a managed portfolio with a matched index and build a written process of their own. There is nothing to buy on the call.
What does a discretionary fund manager actually do?
A discretionary fund manager (DFM) runs your portfolio for you. You agree a risk level and objectives, and the manager buys and sells without asking you first. Firms in the UK private client market include names such as RBC Brewin Dolphin, Quilter Cheviot, Waverton, Rowan Dartington and Tideway, alongside many others.
Some offer a fully bespoke portfolio with a named investment manager. Others offer a managed portfolio service (MPS), where you hold one of a handful of model portfolios. Bespoke tends to cost more, and the minimum investment is often higher. Quilter Cheviot, for example, says its Discretionary Portfolio Service is for people investing more than £250,000. Quilter Cheviot (opens in a new tab)
What you are buying is judgement: asset allocation, fund and share selection, and the discipline of someone else watching the portfolio. The question is whether that judgement adds more than it costs.
How do managed balanced portfolios compare with the index?
The best public evidence on what private clients actually earn comes from the ARC Private Client Indices, now part of S&P Dow Jones Indices. They are built from real discretionary client portfolios submitted by participating managers, and the figures are net of fees. Each portfolio is placed in a risk band by ARC, measured against world equities: Balanced Asset is 40% to 60% of world equity risk, Steady Growth 60% to 80%, and Equity Risk 80% to 110%. ARC Sterling PCI report (opens in a new tab)
The MSCI PIMFA Private Investor Balanced index is the benchmark the industry body PIMFA uses for a balanced private client. It holds about 60% in shares (42.5% international and 17.5% UK), with the rest in gilts, corporate bonds, alternatives, property and cash. It is an index, so no fees are taken. MSCI PIMFA factsheet (opens in a new tab)
| Calendar year | ARC Balanced Asset | ARC Steady Growth | ARC Equity Risk | MSCI PIMFA Balanced (TR Net) |
|---|---|---|---|---|
| 2020 | 4.3% | 4.6% | 5.8% | 1.95% |
| 2021 | 7.6% | 10.2% | 12.3% | 12.54% |
| 2022 | -9.1% | -10.2% | -11.4% | -8.10% |
| 2023 | 5.8% | 7.2% | 8.3% | 10.11% |
| 2024 | 6.4% | 7.9% | 9.3% | 10.73% |
| 2020–2024 total (calculated) | 14.8% | 19.7% | 24.6% | 28.6% |
Sources: ARC Sterling PCI performance report (opens in a new tab) (S&P Dow Jones Indices, September 2026 edition); MSCI PIMFA Private Investor Balanced factsheet (opens in a new tab) (December 2024). Five-year totals are compounded from the calendar-year figures. Past performance is not a reliable indicator of future results.
Source: ARC Sterling PCI (S&P Dow Jones Indices) and MSCI PIMFA Private Investor Balanced factsheet. Calculated cumulative returns, 2020 to 2024.
Two fair caveats. First, the comparison is not perfectly like for like: the PIMFA index carries more equity risk than the ARC Balanced band, and its five-year volatility to the end of 2024 was 9.89% a year. Second, an index costs nothing, and no real investor can buy it for free. Even so, the highest-risk ARC category still trailed a balanced index, and in 2025 the ARC Balanced Asset index returned 9.1%. ARC Sterling PCI report (opens in a new tab)
The spread between managers is also wide. Over ten years to September 2026, the top-quartile ARC Balanced Asset contributor returned 60.7% in total and the bottom-quartile one 47.9%. ARC Sterling PCI report (opens in a new tab) Some firms do beat the peer group. W1M, the firm formed when Waverton merged with London & Capital, reports that its Sterling Balanced Asset index returned 10.82% in 2025, 1.67 percentage points ahead of the ARC peer index. W1M ARC PCI report (opens in a new tab), W1M (opens in a new tab) Beating peers, though, is not the same as beating a matched index after costs.
Why does a balanced portfolio lag the index?
Fees come out every year
Discretionary fees are usually a percentage of your portfolio, often with VAT on top, plus the charges of the funds held inside it. That stack is the single most reliable drag, because it is taken whether markets rise or fall.
| Firm (published tariff) | Annual management fee | What else to add |
|---|---|---|
| RBC Brewin Dolphin, Discretionary Investment Management only (Fee Only) | 1.3% on the first £1m, 0.9% on the next £1m, 0.6% on the next £3m | VAT, fund charges, transaction charges. Its own £500,000 example totals £10,992 a year, or 2.2% |
| Quilter Cheviot | 1.00% up to £1m, 0.5% from £1m to £2.5m, 0.4% from £2.5m to £5.5m, 0.3% above | Subject to VAT; transaction and incidental costs |
| Tideway | Single fee of 1% a year, covering advice, platform and model portfolio management | Third-party fund charges of 0.4% to 0.9% |
| Waverton (now W1M), bespoke portfolios | 1.00% on the first £5m for standard clients; 0.75% plus VAT for clients of advisers (£1m minimum) | Total bespoke costs "typically range from 0.90% - 1.20% (before VAT)" for adviser clients, plus the adviser's fee |
| Rowan Dartington, Collective Portfolio Service (factsheet, February 2024) | 0.35% plus VAT, plus a 0.30% admin charge | Fund charges (OCF 0.68% in that factsheet) |
Sources: RBC Brewin Dolphin services and charges (opens in a new tab) (May 2026); Quilter Cheviot guide to bespoke investment management (opens in a new tab); Tideway fees (opens in a new tab); W1M due diligence report for advisers (opens in a new tab) and W1M ARC due diligence questionnaire (opens in a new tab); Rowan Dartington Intermediaries Adventurous factsheet (opens in a new tab). Published rates only; individual terms can differ, so check your own agreement.
Now set that against a do-it-yourself route. In an illustrative example, £500,000 in a Vanguard Personal Pension holding the Vanguard LifeStrategy 60% Equity Fund would cost the £375 platform cap plus a 0.20% fund charge, about £1,375 a year. Vanguard Personal Pension (opens in a new tab), Vanguard LifeStrategy 60% (opens in a new tab) That fund is an example of a ready-made balanced index fund, not a recommendation.
Over time the difference compounds. In an illustrative example where £500,000 earns 6% a year before costs, ten years at 2.2% a year in total costs leaves about £726,000. At 0.3% it leaves about £870,000. That is a gap of roughly £144,000, from costs alone. My piece on what 1% a year really costs your portfolio works through more examples.
Most active managers do not beat their index
Fees would matter less if active selection reliably added more than it cost. The evidence says it usually does not. The SPIVA Europe Year-End 2025 Scorecard found that over ten years to the end of 2025, 97.01% of sterling-denominated global equity funds and 92.98% of UK equity funds underperformed their benchmark. SPIVA Europe Year-End 2025 (opens in a new tab)
A discretionary portfolio is often built from exactly these active funds, plus the manager's own layer of decisions on top. Two layers of active management, each with a cost, have to work hard to beat a single low-cost index.
"Balanced" often means less in shares
Labels such as cautious, balanced and growth are not standard. One firm's balanced can hold far less in shares than another's, and less than the index it is shown against. Over long periods shares have tended to grow faster than bonds and cash, so a lower share weighting usually means lower long-run returns, as well as smaller falls. My review of what cautious, balanced and adventurous labels really mean shows how wide the range can be.
The benchmark is often a peer group, not an index
Many managers show their performance against the ARC peer index for their risk band. That tells you whether you did better than other managers, after their fees. It does not tell you whether you did better than a simple index portfolio you could have bought yourself.
How do I review my discretionary fund manager?
You do not need to be a professional to run a fair review. You need four numbers and an honest comparison.
Total cost in pounds. Your annual costs and charges report must show the manager's fee, VAT, fund charges and transaction costs. Add them up and turn the percentage into pounds. RBC Brewin Dolphin's own worked example shows how quickly it adds up: £10,992 a year on £500,000. RBC Brewin Dolphin (opens in a new tab)
Your share weighting. Ask what percentage of the portfolio is in shares, and how that has changed over five years.
Your return after all costs. Ask for calendar-year returns for at least five years, after every charge.
A matched index. Compare those returns with a published index of similar risk, or a low-cost multi-asset index fund with a similar share weighting, over the same years. If the gap is wide and persistent, ask the manager to explain it in writing.
Watch for exit costs before you move. Some firms charge per holding to transfer shares out, so check the tariff and whether you can transfer "in specie" rather than selling to cash. If the money is in a pension, check for any guarantees or protected benefits before transferring anything.
Why manage your own money?
Fees are the obvious reason. Control is the bigger one.
Control. You decide the share weighting, the funds or shares you hold, how much goes into any one position and when you rebalance. Nothing changes without your say.
Transparency. You see every holding and every charge, and you know exactly why your portfolio rose or fell.
A portfolio built around you. A model portfolio is designed for a type of client. A self-run portfolio can be built around your own risk profile, income needs and timetable.
The trade-off is responsibility. The investors who do well on their own have a written process: how they pick investments, how much they put in each, when they sell and when they rebalance. They write it down before markets get rough, not during. The run your own SIPP and review your adviser guides cover the practical steps, and our free Portfolio Odds (opens in a new tab) tool helps you explore how likely a loss is for a given mix under its assumptions.
What to do next
- Pull your last annual costs and charges statement and convert the total into pounds a year.
- Ask your manager for five calendar years of returns after all costs and the share weighting in each year.
- Pick a matched index or low-cost multi-asset index fund and compare the same years side by side.
- Check exit terms in writing, including transfer charges and whether holdings can move in specie.
- Write your own process, covering what you would buy, position sizes, rebalancing dates and sell rules, before you decide anything.
Want a second pair of eyes on your managed portfolio? Book your free call with Alpesh's team. We will show you how self-directed investors check costs against a matched index, then pick, size and review their own investments with a written plan. There is nothing to buy on the call.
Frequently asked questions
Are discretionary fund managers worth the fees?
Some are, for some clients, particularly those who value delegation and would otherwise not invest with any discipline. The peer data shows a wide spread between managers, so the answer depends on your firm. Compare your returns after all costs with a matched index over at least five years.
What is a typical discretionary fund management fee in the UK?
Published tariffs for bespoke services often run from around 0.75% to 1.3% a year on the first slice for the manager's fee alone, usually with VAT on top. Fund charges and transaction costs come on top of that. RBC Brewin Dolphin's own £500,000 example totals 2.2% a year including everything.
What are the ARC Private Client Indices?
They are peer-group indices built from real discretionary client portfolios submitted by participating managers, grouped by risk and reported net of fees. They are now part of S&P Dow Jones Indices. They show how managers performed against each other, not against a market index.
Can I move away from my discretionary manager without selling everything?
Often, yes. Many firms can transfer holdings in specie to a new platform, although some charge per holding to do so. Check the exit section of your tariff first, and check any pension for guarantees or protected benefits before transferring.
About Alpesh Patel OBE
Alpesh Patel OBE is Founding Principal of Rootbridge Capital, an author and Dealmaker for the UK Government's Department for Business. He is a former Visiting Fellow in Business, Corpus Christi College, Oxford University, where he worked on technology to improve financial education.
Sources
- S&P Dow Jones Indices, ARC Sterling PCI performance report (opens in a new tab)
- MSCI, MSCI PIMFA Private Investor Balanced Index factsheet (opens in a new tab)
- W1M (Waverton), Sterling PCI report, December 2025 (opens in a new tab)
- S&P Dow Jones Indices, SPIVA Europe Year-End 2025 Scorecard (opens in a new tab)
- RBC Brewin Dolphin, Our services and charges (opens in a new tab)
- Quilter Cheviot, Investment management costs and charges (opens in a new tab)
- Quilter Cheviot, Guide to bespoke investment management (opens in a new tab)
- Tideway, Our fees (opens in a new tab)
- W1M, London & Capital and Waverton officially combine as W1M (opens in a new tab)
- W1M, Due diligence report for professional advisers (opens in a new tab)
- W1M, ARC annual due diligence questionnaire (opens in a new tab)
- Rowan Dartington, Intermediaries Adventurous portfolio factsheet (opens in a new tab)
- Vanguard, Personal Pension (opens in a new tab)
- Vanguard, LifeStrategy 60% Equity Fund (opens in a new tab)
- Alpesh Patel OBE, Fund Managers Underperform: My Radical Plan (opens in a new tab) (YouTube)
Important: This article is for education only and is not personal financial advice or a recommendation to buy or sell any investment. This article is general investment education only and is not regulated investment advice. The value of investments can go down as well as up, and you may get back less than you invest. Past performance is not a reliable indicator of future results.
Important: this article is education and information only. It is not financial advice or a personal recommendation, and it does not take your circumstances into account. The value of investments and pensions can fall as well as rise, and you may get back less than you put in. Past performance is not a reliable indicator of future results. Figures were correct when the article was written and may have changed. If you are unsure what is right for you, speak to a regulated financial adviser.