Maximum Drawdown: How Far Could My Portfolio Fall, and Could I Live With It?
"How far could my portfolio fall?" is one of the questions my team hears most often on calls. It usually comes from someone with a large pot, often a seven-figure one, who has done well in rising markets and is now wondering what a really bad year would look like in pounds rather than percentages.
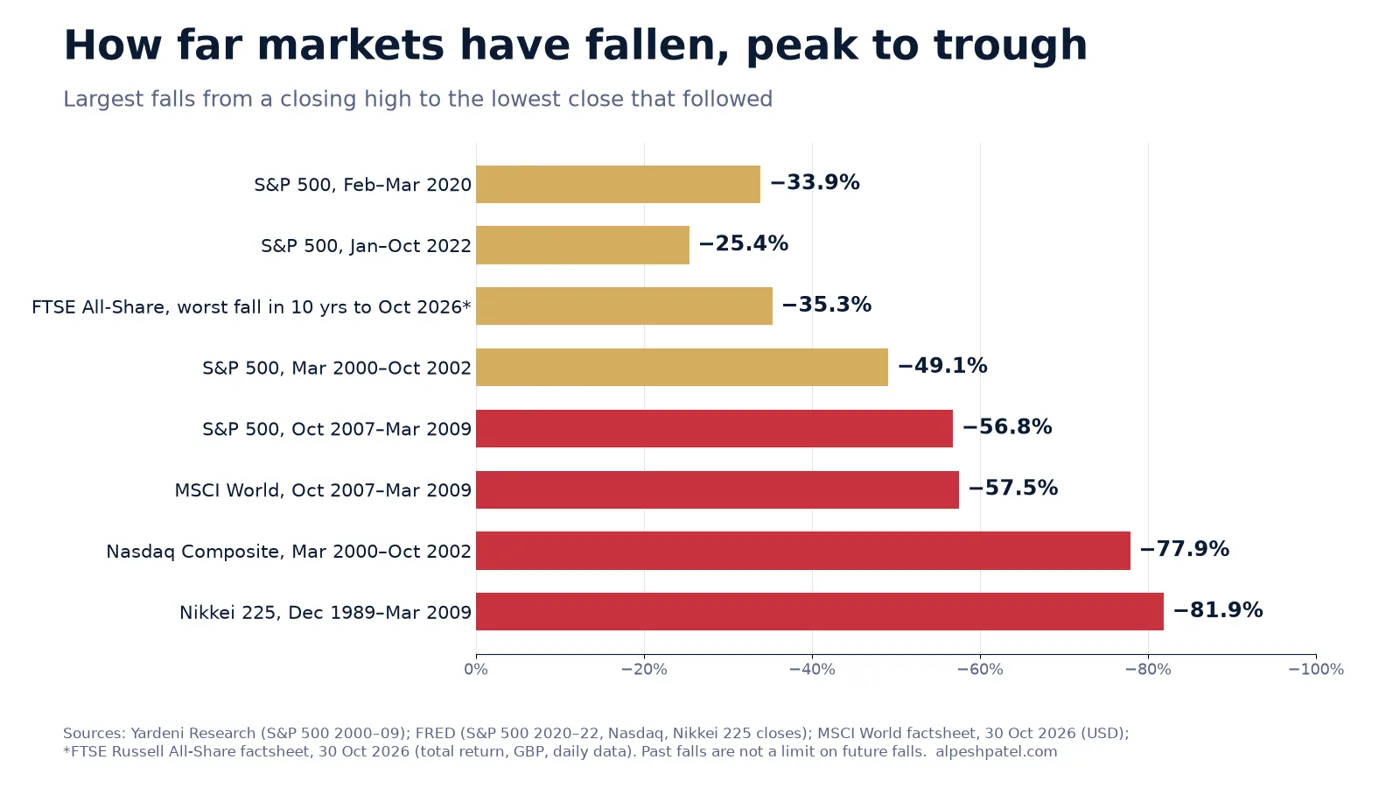
The honest answer is further than most people expect. Investors measure that answer with maximum drawdown. From its closing high on 9 October 2007 to its low on 9 March 2009, the S&P 500 fell 56.8% (Yardeni Research (opens in a new tab)). The MSCI World index, which covers large and mid-sized companies across developed markets, fell 57.46% between 31 October 2007 and 9 March 2009 (MSCI World factsheet, 30 October 2026 (opens in a new tab)). On a £1 million portfolio fully in shares, a fall like that would take roughly £570,000 off its value.
Japan is the warning that matters most. The Nikkei 225 closed at 38,915.87 on 29 December 1989 and did not close above it again until 22 February 2024, more than 34 years later (FRED, Nikkei 225 (opens in a new tab)). The worst fall you have seen so far is not the worst fall that can happen.
Short answer: Maximum drawdown is the largest fall from a portfolio's peak to its lowest point before a new peak. Broad share markets have fallen 25% to 57% in recent crises, and single markets and shares have fallen 80% or more. Size your portfolio so that a fall of that size would not force you to sell or change your life.
Not sure how far your own portfolio could fall? Book your free call with Alpesh's team. We will show you how self-directed investors measure the downside, size positions and plan what to do in a fall before it happens. There is nothing to buy on the call.
What is maximum drawdown?
Drawdown is the fall from a previous high. Maximum drawdown is the biggest of those falls over a given period, measured from the peak to the lowest point before the portfolio recovers to a new high.
Here is a simple illustrative example. Say your portfolio grows from £500,000 to a peak of £600,000. A bear market arrives and it falls to £390,000 before recovering. Your maximum drawdown is £210,000, or 35% of the £600,000 peak.
Two things about that example catch people out. First, the drawdown is measured from the peak, not from what you put in. You may still be "up" on your original £500,000 in your head, but you have lost more than a third of what you had. Second, recovery takes a bigger gain than the fall. To get from £390,000 back to £600,000 you need a rise of about 54%.
| Illustrative fall from peak | Gain needed to get back to the peak |
|---|---|
| 10% | 11.1% |
| 20% | 25.0% |
| 35% | 53.8% |
| 50% | 100.0% |
| 57% | 132.6% |
| 82% | 455.6% |
Arithmetic, not a forecast: the gain needed is 1 ÷ (1 − fall) − 1.
That asymmetry is why drawdown, more than average return, decides whether a plan survives. A portfolio that falls 50% needs to double just to stand still.
How far have stock markets fallen in the past?
The falls below are measured from a closing high to the lowest close that followed. They are price index figures, so dividends are not included, except where noted.
Source: Yardeni Research; FRED, Federal Reserve Bank of St. Louis; MSCI World factsheet and FTSE All-Share factsheet, both as at 30 October 2026.
| Market and period | Peak close | Trough close | Fall | Back above the old peak |
|---|---|---|---|---|
| S&P 500, dot-com bust | 24 Mar 2000 (1,527.46) | 9 Oct 2002 (776.76) | −49.1% | Not shown |
| S&P 500, financial crisis | 9 Oct 2007 (1,565.15) | 9 Mar 2009 (676.53) | −56.8% | 28 Mar 2013, about 5.5 years after the peak |
| S&P 500, Covid crash | 19 Feb 2020 (3,386.15) | 23 Mar 2020 (2,237.40) | −33.9% | 18 Aug 2020, about 6 months |
| S&P 500, 2022 rate rises | 3 Jan 2022 (4,796.56) | 12 Oct 2022 (3,577.03) | −25.4% | 19 Jan 2024, about 2 years |
| MSCI World (USD), financial crisis | 31 Oct 2007 | 9 Mar 2009 | −57.46% | Not shown |
| Nasdaq Composite, dot-com bust | 10 Mar 2000 (5,048.62) | 9 Oct 2002 (1,114.11) | −77.9% | 23 Apr 2015, about 15 years |
| Nikkei 225, Japan's bubble | 29 Dec 1989 (38,915.87) | 10 Mar 2009 (7,054.98) | −81.9% | 22 Feb 2024, about 34 years |
Sources: S&P 500 2000–2009 falls from Yardeni Research (opens in a new tab); 2013 record from Reuters (opens in a new tab); S&P 500 2020–2024 closes from FRED, S&P 500 (opens in a new tab); Nasdaq closes from FRED, Nasdaq Composite (opens in a new tab); Nikkei closes from FRED, Nikkei 225 (opens in a new tab); MSCI World from the MSCI World factsheet (opens in a new tab), 30 October 2026.
What about UK shares?
The FTSE All-Share, which covers around 98% of the UK market by value, had a maximum drawdown of 35.3% over the 10 years to 30 October 2026, measured on daily total return data in sterling (FTSE Russell All-Share factsheet (opens in a new tab)). That window includes the Covid fall of early 2020.
Recovery in the UK has been slow too. The FTSE 100 closed at a record 6,930.2 on 30 December 1999 and did not close higher until 24 February 2015, when it ended at 6,949.63 (BBC News (opens in a new tab)). Dividends paid along the way softened that, but on price alone it was a 15-year wait.
Why isn't the worst past fall a limit on future losses?
Because history is one path out of many that could have happened. Every record drawdown was, before it happened, worse than anything in the data up to that point.
Japan shows this best. In 1989 Japanese shares were the market everyone wanted to own. An investor who sized their risk by looking at the Nikkei's worst past fall would have had no warning of what came next: a fall of 81.9% from the 1989 closing high to the March 2009 low, and 34 years before the old high was beaten (FRED, Nikkei 225 (opens in a new tab)).
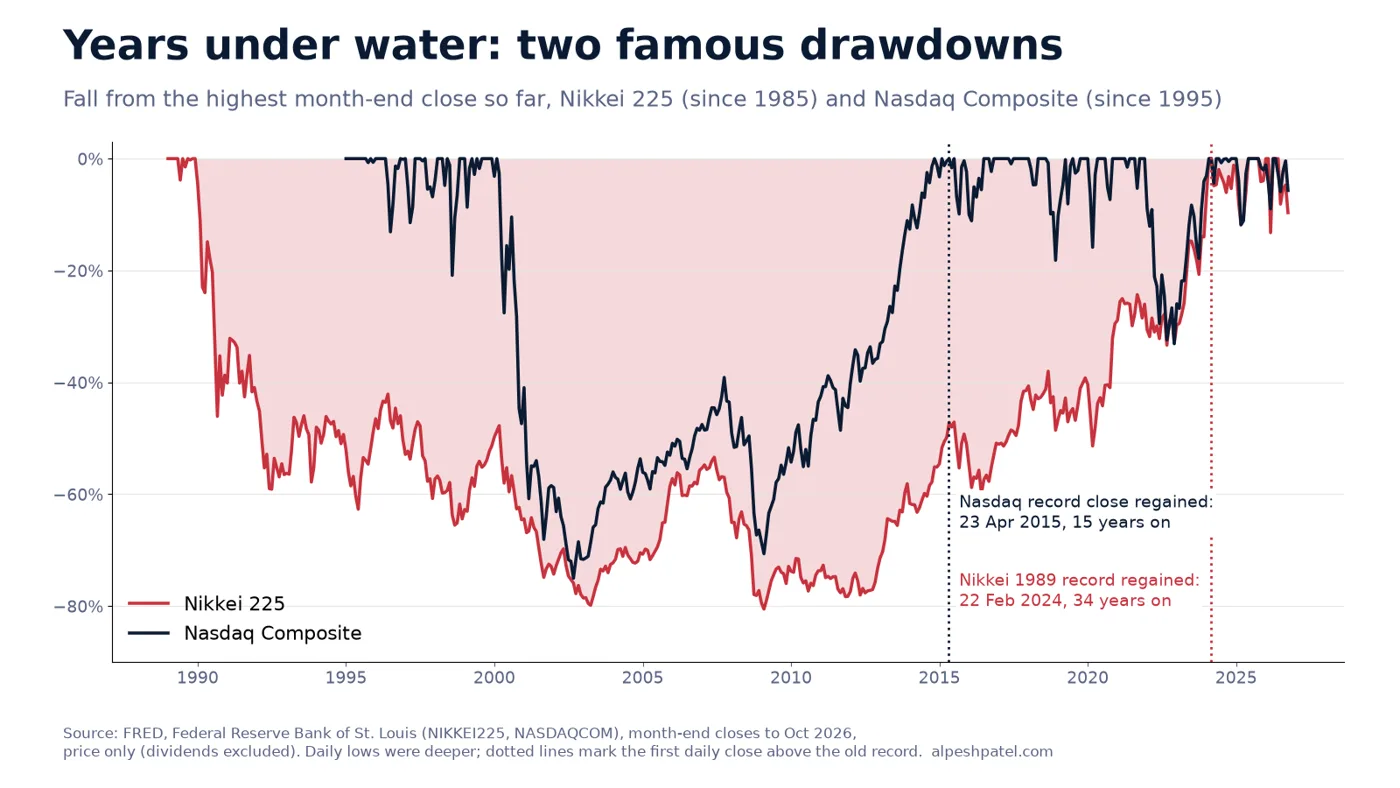
Source: FRED, Federal Reserve Bank of St. Louis, month-end closes to October 2026, price only.
The Nasdaq Composite tells a similar story closer to home for anyone who owns technology shares. It fell 77.9% from March 2000 to October 2002 and took until April 2015 to close above its old high (FRED, Nasdaq Composite (opens in a new tab)).
Single shares can fall further still. An index spreads the damage across hundreds of companies. One company can fall 90% or go to zero, and investors who own a handful of concentrated positions can see drawdowns much deeper than any index. That is why I treat a share's past maximum drawdown as a floor for what could happen, not a ceiling.
How is drawdown different from volatility?
Volatility measures how much returns bounce around their average, usually as an annualised standard deviation. Drawdown measures the actual damage from a peak. They answer different questions.
The figures show how far apart they can be. The MSCI World had annualised volatility of 14.86% over the 10 years to 30 October 2026, yet its maximum drawdown since 1987 is 57.46% (MSCI World factsheet (opens in a new tab)). The FTSE All-Share had five-year volatility of 10.5%, yet a 10-year maximum drawdown of 35.3% (FTSE Russell (opens in a new tab)).
Calendar-year returns can hide drawdowns as well. The S&P 500 fell 33.9% between February and March 2020 (FRED (opens in a new tab)), yet the MSCI World ended 2020 up 16.50% in US dollars (MSCI (opens in a new tab)). If you only look at yearly returns, you miss the month when many investors panicked and sold.
My explainer on what 20% volatility in a stock or fund means goes deeper on volatility. If you want a single number that links return to drawdown, the Calmar ratio does exactly that, and I compare it with Sharpe and Sortino in Sharpe vs Sortino vs Calmar ratio.
How do I size my portfolio to a fall I could live through?
I call this the bad year test. Before you decide how much to hold in shares, work out what a deep fall would cost you in pounds, and ask yourself honestly whether you would hold on.
Here is an illustrative version on a £1 million portfolio. It assumes shares fall 50%, close to the falls of 2000–02 and 2007–09, and that the rest of the portfolio holds its value. That second assumption is generous: bonds and other assets do not always protect you in a fall.
| Illustrative mix (shares / other) | Fall if shares drop 50% | Portfolio value at the low |
|---|---|---|
| 100% / 0% | £500,000 | £500,000 |
| 80% / 20% | £400,000 | £600,000 |
| 60% / 40% | £300,000 | £700,000 |
| 40% / 60% | £200,000 | £800,000 |
Illustrative arithmetic only, not a forecast or a recommended mix.
Three questions turn the table into a decision:
- Would I sell? If seeing £400,000 disappear would make you sell near the bottom, your share allocation is too high for you, whatever the long-run return tables say.
- Would I need the money? If you would have to draw on the portfolio during the fall, the loss stops being "on paper".
- Would my plan still work? Run the lower value through your retirement sums. The free Portfolio Odds (opens in a new tab) tool lets you explore how likely a loss is for a given mix under its assumptions, and the Probability (opens in a new tab) tool helps you think in ranges rather than single forecasts.
The same test works inside the portfolio. If one share could fall 80%, how much of your total would that cost? Holding it at 5% of the portfolio means a 4% hit. Holding it at 25% means 20%. My guide to position sizing for high-conviction investing explains how to set those limits before you buy.
Why does the order of returns matter when you are withdrawing?
Once you start taking income, a drawdown does more damage. Money withdrawn at the bottom is sold at low prices and is not there for the recovery. This is sequence of returns risk.
Here is an illustrative example. Two investors each start with £1 million and take £50,000 at the start of every year for 10 years. Both get exactly the same 10 yearly returns, which include falls of 25% and 15%. The only difference is the order.
| Illustrative 10-year path | Value after 10 years |
|---|---|
| Falls of 25% and 15% in years 1 and 2 | about £531,000 |
| Same returns in reverse: the falls come in years 9 and 10 | about £824,000 |
Illustrative calculation, not a forecast. Yearly returns used: −25%, −15%, +10%, +8%, +12%, +7%, +9%, +11%, +6%, +10%.
Same average return, same withdrawals, and a gap of nearly £300,000. That is why the years either side of retirement matter so much.
There are practical ways to reduce the risk. Many self-directed investors hold two or three years of planned withdrawals in cash or short-dated assets, so they are not forced to sell shares in a fall. Others set a rule to take less in a down year. The order you draw from different pots matters too, and my comparison of six withdrawal strategies works through the options. The protect your portfolio in a crash guide covers the steps.
Why manage your own downside?
When someone else runs your money, a drawdown arrives as a statement. When you run it yourself with a written process, you decide in advance how much you hold in shares, how much any one position can cost you, and what you will do if markets fall 20%, 35% or 50%.
That control is the real benefit. You can build a portfolio around your own risk profile, your income needs and the fall you could genuinely live through, rather than a model portfolio designed for an average investor. You can see every holding, so a fall is never a mystery. And because the rules are written down before the crash, you are far less likely to sell at the bottom.
You do not need to be a professional to do this. You need a process: what you buy, how much of each, when you rebalance and when you sell.
What to do next
- Find your own maximum drawdown. Look at your portfolio's value at its highest point and its lowest point since, in pounds and as a percentage.
- Run the bad year test. Work out what a 50% fall in your shares would cost you in pounds, and decide honestly whether you would hold on.
- Check your biggest positions. For each one, multiply its weight by a possible 80% fall and see what that costs the whole portfolio.
- Plan your withdrawals. If you are taking income, decide how much to hold outside shares and what you will do in a down year.
- Write the rules down. Your mix, position limits, rebalancing dates and sell rules, before the next fall rather than during it.
Want a written plan for the next market fall? Book your free call with Alpesh's team. We will walk through how self-directed investors size their portfolios to a fall they can live through, and how they pick, size and sell. There is nothing to buy on the call.
Frequently asked questions
What is a good maximum drawdown for a portfolio?
There is no single right number. The right figure is the largest fall you could sit through without selling or changing your plans, in pounds as well as percentages. Many investors find that figure is lower than they assumed once they see it as a sum of money.
How long does the stock market take to recover from a crash?
It has ranged from months to decades. The S&P 500 regained its February 2020 high within about six months, took about five and a half years after the 2007 peak, and the Nikkei 225 took more than 34 years to beat its 1989 high.
Is maximum drawdown the same as volatility?
No. Volatility measures how much returns swing around their average, while maximum drawdown measures the largest actual fall from a peak. A market with 15% annual volatility has still fallen more than 50% in a single crisis.
Can a diversified portfolio still fall 50%?
Yes. A portfolio made only of shares, even spread across the world, fell by more than half in 2007–09: the MSCI World's maximum drawdown was 57.46%. Holding other assets can reduce the fall, but no mix removes the risk entirely.
What is sequence of returns risk?
It is the risk that poor returns arrive early, just as you start taking withdrawals. Selling investments at low prices to fund income leaves less to recover, so the same average return can leave you with far less money.
About Alpesh Patel OBE
Alpesh Patel OBE is Founding Principal of Rootbridge Capital, an author and Dealmaker for the UK Government's Department for Business. He is a former Visiting Fellow in Business, Corpus Christi College, Oxford University, where he worked on technology to improve financial education.
Sources
- Yardeni Research, Stock Market Historical Tables: Bull & Bear Markets (opens in a new tab)
- MSCI, MSCI World Index factsheet, 30 October 2026 (opens in a new tab)
- FTSE Russell, FTSE All-Share Index factsheet, 30 October 2026 (opens in a new tab)
- Federal Reserve Bank of St. Louis, FRED: S&P 500 (opens in a new tab)
- Federal Reserve Bank of St. Louis, FRED: Nasdaq Composite Index (opens in a new tab)
- Federal Reserve Bank of St. Louis, FRED: Nikkei Stock Average, Nikkei 225 (opens in a new tab)
- Reuters, Key dates and milestones in the S&P 500's history (opens in a new tab)
- BBC News, FTSE 100 closes at record level (opens in a new tab)
- Alpesh Patel, Portfolio Odds (opens in a new tab) and Probability (opens in a new tab) tools
Important: This article is for education only and is not personal financial advice or a recommendation to buy or sell any investment. This article is general investment education only and is not regulated investment advice. The value of investments can go down as well as up, and you may get back less than you invest. Past performance is not a reliable indicator of future results.
Important: this article is education and information only. It is not financial advice or a personal recommendation, and it does not take your circumstances into account. The value of investments and pensions can fall as well as rise, and you may get back less than you put in. Past performance is not a reliable indicator of future results. Figures were correct when the article was written and may have changed. If you are unsure what is right for you, speak to a regulated financial adviser.