Spread Across Three Platforms but Still Concentrated? How to Find Hidden Overlap
Picture someone a decade or so from winding down work, with a substantial portfolio spread across three providers: say, a mainstream platform such as Hargreaves Lansdown, a wealth manager such as Evelyn Partners running a managed or discretionary portfolio, and a broker such as Interactive Brokers holding shares they picked themselves. Three platforms, dozens of lines. It feels diversified, yet the nagging worry is the opposite: too many holdings, and still too concentrated.
That worry is usually right, and the reason is hidden overlap. On 18 November 2026 the ten largest positions in the State Street SPDR S&P 500 ETF made up 37.0% of the fund, with Apple at 8.13% and Nvidia at 5.78%, according to State Street's daily holdings file (opens in a new tab). Hold an S&P 500 tracker on one platform, a managed portfolio with a US slice on another and a handful of US tech shares on a third, and you can own the same few companies three times.
Spreading money across platforms spreads your paperwork, not your risk. The fix is one combined view of what you really own, and a written process for what to do about it.
Short answer: Hidden overlap is when different accounts and funds hold the same underlying companies. To find it, list every account, look through each fund to its top holdings, add up your exposure to each company across all platforms and compare it with a written cap. Tidy inside ISAs and SIPPs first, where switching triggers no Capital Gains Tax.
Not sure how much of your money is really in the same few companies? Book your free call with Alpesh's team. We will show you how self-directed investors build one combined view across platforms and decide what to own, how much and when to sell. There is nothing to buy on the call.
Why does more holdings not mean more diversification?
Diversification works by adding things that do not move together. Each new share you add cuts a little of the risk that is specific to one company. After a point, the extra cut is tiny, and what is left is market risk that no number of lines will remove.
The academic evidence on this is old and consistent. In a 1987 paper in the Journal of Financial and Quantitative Analysis (opens in a new tab), Meir Statman summarised earlier work by Elton and Gruber: going from 1 to 10 randomly chosen shares removed 51% of a portfolio's standard deviation, the next 10 removed about another 5%, and going to 30 removed only about 2% more. Statman himself argued for at least 30 to 40 shares once costs are weighed against the gains.
So beyond about 20 to 30 well-chosen, genuinely different holdings, adding more achieves little. A portfolio of 80 lines across three platforms is not four times safer than one with 20, and every extra line is one more thing to monitor. Too many holdings means decisions get skipped.
What is hidden overlap, and where does it hide?
Hidden overlap is exposure you cannot see on any single statement, because no platform shows what your funds own underneath or what you hold elsewhere.
The S&P 500 is weighted by company size, and covers approximately 80% of available US market capitalisation, according to S&P Dow Jones Indices (opens in a new tab). So most US and global equity funds, active or passive, hold the same large companies near the top.
| S&P 500 ETF top 10 positions, 18 November 2026 | Weight |
|---|---|
| Apple | 8.13% |
| Microsoft | 5.96% |
| Nvidia | 5.78% |
| Amazon | 4.16% |
| Broadcom | 2.66% |
| Alphabet (Class A) | 2.62% |
| Meta Platforms | 2.15% |
| Alphabet (Class C) | 2.10% |
| Eli Lilly | 1.75% |
| Tesla | 1.71% |
| Top 10 total | 37.02% |
Source: State Street SPDR S&P 500 ETF holdings (opens in a new tab), as of 18 November 2026. Alphabet's two share classes are listed separately; together they are 4.72%.
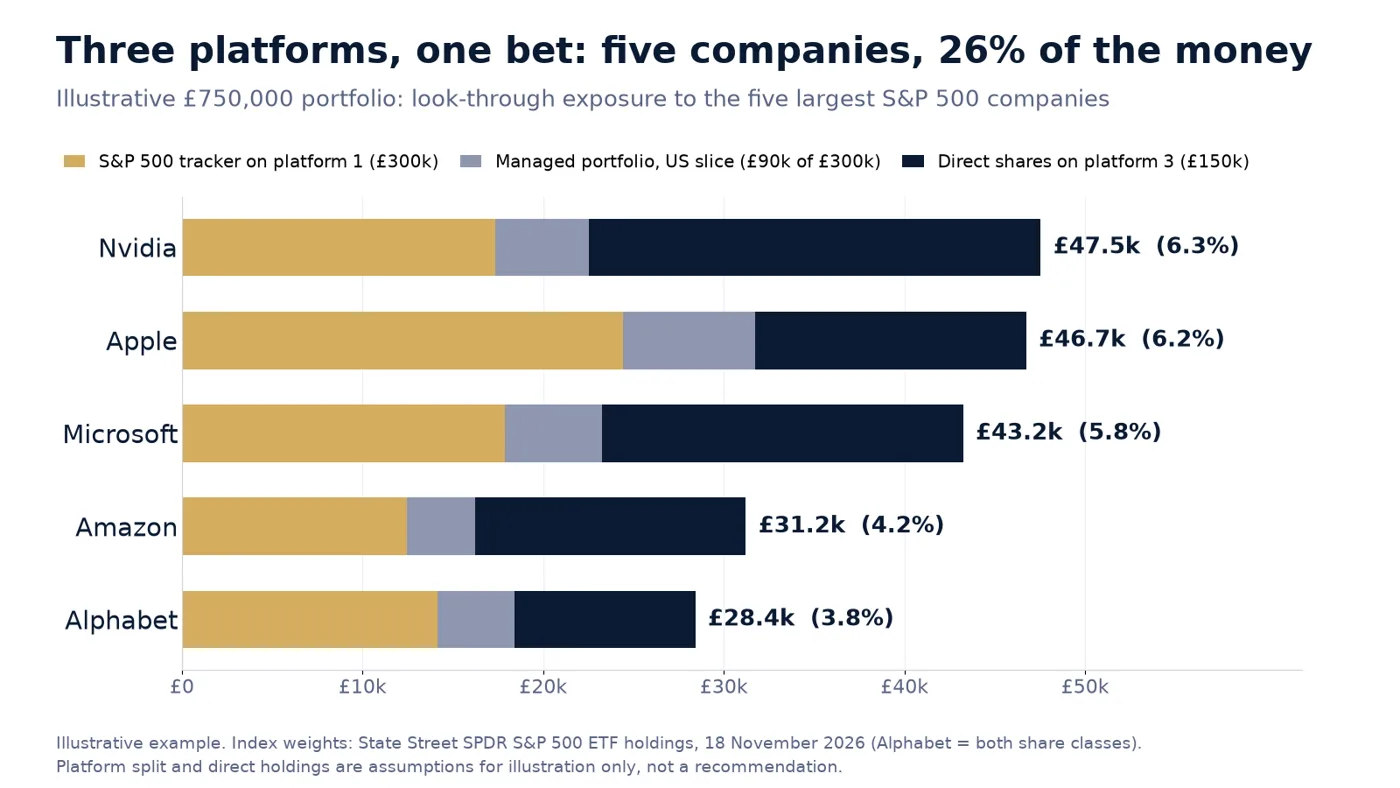
Now layer the three platforms on top of each other. Here is an illustrative example on £750,000: £300,000 in an S&P 500 tracker across an ISA and SIPP on one platform, £300,000 in a discretionary portfolio of which £90,000 is a US large-company slice, and £150,000 of direct shares on a third platform, mostly in well-known US technology names.
Source: index weights from State Street SPDR S&P 500 ETF holdings, 18 November 2026; platform split and direct holdings are illustrative assumptions.
In that illustrative case, five companies add up to about £197,000, or 26% of the whole portfolio, and Nvidia alone is 6.3%. Each account looks sensible on its own. Together they are one large bet on a handful of US technology companies, which is the subject of our post on whether S&P 500 concentration and the Magnificent Seven should worry you.
For many funds inside accounts you cannot merge, see too many funds, same index; this post is the multi-platform version.
What does a discretionary manager cost compared with a platform?
Overlap is also a cost problem: you may be paying a manager to hold the companies your tracker already owns.
Evelyn Partners publishes a Discretionary Portfolio Service fee schedule (opens in a new tab). The investment management fee is 1.05% on the first £250,000, 0.90% on the next £250,000 and 0.70% on the next £2 million, plus VAT. A custody fee of 0.20% a year is added, with no VAT. Underlying fund charges are extra (normally around 0.85% for equity funds and 0.30% for trackers, it says), as is £10 per overseas transaction. Managed portfolio services are priced differently, so check your own schedule.
Hargreaves Lansdown's published charges (opens in a new tab) are 0.35% on the first £250,000 in funds, 0.25% from £250,000 to £1 million, and 0.35% on shares and ETFs capped at £12.50 a month, which is £150 a year per account. Interactive Brokers UK (opens in a new tab) says it charges no custody fees, with UK share commissions on its fixed plan of 0.05% of trade value, minimum £3, and a minimum activity fee on ISA accounts.
| Illustrative yearly cost on £750,000 | Annual fee | As % |
|---|---|---|
| Evelyn Discretionary Portfolio Service (management £6,625 + VAT £1,325 + custody £1,500) | £9,450 | 1.26% |
| Hargreaves Lansdown, all held in funds | £2,125 | 0.28% |
| Hargreaves Lansdown, all in shares or ETFs (one account) | £150 | 0.02% |
| Interactive Brokers, holding charge | £0 | 0% |
Illustrative, calculated from each firm's published charges in November 2026. Excludes underlying fund charges, dealing costs, FX and stamp duty. Evelyn's own example on £800,000 is £9,970 a year including VAT.
A discretionary manager gives you someone else to make decisions. The question is what you get for £9,450 a year that your tracker and your own shares do not already give you. If the honest answer is the same mega-caps in a different wrapper, that deserves a hard look. We break down the long-run effect in what a 1% wealth management fee really costs, and compare the two self-directed platforms in Interactive Brokers vs Hargreaves Lansdown for a self-directed SIPP.
How do I find hidden overlap across platforms?
You can build a combined look-through view in an afternoon with a spreadsheet.
- Gather every statement. Download a valuation from each platform and manager, including old pensions and cash, at the same date.
- Label each account type. ISA, SIPP or other pension, or general account. This decides what you can change without tax.
- Look through each fund. Copy the top 10 holdings and weights from each factsheet, ask any manager for a full holdings list, and multiply each weight by what you hold.
- Add your direct shares. Put the value of each share you own directly next to the look-through figures.
- Build a top 20. Total each company across every account, sort largest first and show it as a percentage of the whole.
- Make a duplicates table. For each of the top 20, note how many places it appears.
| Duplicates table (illustrative) | Tracker | Managed | Direct | Total | % of £750k |
|---|---|---|---|---|---|
| Nvidia | £17,300 | £5,200 | £25,000 | £47,500 | 6.3% |
| Apple | £24,400 | £7,300 | £15,000 | £46,700 | 6.2% |
| Microsoft | £17,900 | £5,400 | £20,000 | £43,200 | 5.8% |
Illustrative, using the S&P 500 ETF weights above. Your own table will differ.
Usually two things stand out: a few companies far above any size you would choose on purpose, and a long tail of small holdings that adds lines but little else. A free Portfolio Odds (opens in a new tab) check can then show how the combined mix might behave across a range of outcomes.
How do I tidy overlap without a big tax bill?
Order matters. Start where changes are free of tax, and only then touch a general account.
Inside an ISA or SIPP, switching is tax-free. GOV.UK confirms you pay no tax on income or capital gains from investments in an ISA (opens in a new tab), and the same applies within a registered pension. Selling a duplicated fund inside either and buying something different costs only dealing charges. This is usually where most of the clean-up can happen.
In a general investment account, Capital Gains Tax applies. For 2026 to 2027 the annual exempt amount is £3,000, and individuals pay 18% or 24% on gains above it depending on their income, according to GOV.UK's Capital Gains Tax rates and allowances (opens in a new tab). Spreading sales across tax years, and using losses, can reduce the bill.
Bed-and-ISA moves money from taxable to tax-free. You cannot transfer shares you already hold into an ISA, as GOV.UK explains (opens in a new tab), so you sell in the general account and buy back inside the ISA, up to the £20,000 annual allowance. The sale counts for Capital Gains Tax, so time it to use your £3,000 exemption. A tax specialist should confirm the details for your situation.
If you keep a discretionary portfolio, tell the manager what you hold elsewhere and ask them to avoid duplicating it.
Why does overlap matter more ten years from retirement?
With ten years to go, the order of returns matters as much as the average. A large fall just before or after you start drawing income does more lasting damage than the same fall at 40, because you sell at low prices to live. This is sequence risk.
Concentration makes sequence risk worse: if a quarter of your money moves with the same few companies, a sharp fall in that group hits hard just when you have least time to recover.
Timing rules matter too. The normal minimum pension age rises from 55 to 57 on 6 April 2028, according to GOV.UK (opens in a new tab). If you plan to stop work before 57, the money for those years may need to come from ISAs and general accounts, which changes what each account should hold. Our guide to retiring before 57 and the bridge years covers this, and it is worth asking whether you should combine your pensions at the same time. You can test your timeline with the free Pension Plan (opens in a new tab) tool.
What should a written investment process include?
Most overlap is never decided; it accumulates. A short written process stops it coming back.
- What to own. One target mix for the whole portfolio, not per platform: for example a broad index core, a set number of individual shares, and bonds or cash for the first years of income.
- How much. A written size limit for any single company on a look-through basis, and a maximum number of holdings you can realistically follow. We cover this in position sizing for high-conviction investing.
- When to sell or rebalance. A calendar date, such as once or twice a year, plus a trigger when any position or asset class drifts past a set band. Write the sell rules before you buy.
This is where managing your own money earns its keep: control over what you hold, transparency on what you pay and one portfolio built around your own risk profile, rather than three that happen to agree. More free calculators are on our tools page.
What to do next
- Pull one statement from every platform with the same valuation date, and label each account type.
- Build your look-through top 20 and duplicates table, using fund factsheets and a full holdings list from any manager.
- Set a written cap for any single company and for US technology as a group, then mark everything above it.
- Tidy inside ISAs and SIPPs first, then plan general account sales and bed-and-ISA around your £3,000 exemption.
- Write your process down: what you own, how much, and when you sell or rebalance, with the 2028 pension age change in your timeline.
Want one clear view of what you really own across every platform? Book your free call with Alpesh's team. We will show you how self-directed investors cut duplication, size positions and set rules for when to sell, so ten years from retirement you know exactly where your risk sits. There is nothing to buy on the call.
Frequently asked questions
How many shares do I need to be diversified?
Research summarised by Statman in 1987 found most of the risk reduction comes from the first 10 to 20 shares, with small gains beyond 30. Holdings being genuinely different matters more than the count.
Is holding several platforms a form of diversification?
It spreads provider risk and paperwork, not market risk. If each platform holds the same large companies, only a look-through view across all accounts shows how concentrated you are.
How do I check what my funds hold?
Each fund's factsheet lists its top 10 holdings, usually monthly, and many ETF providers publish daily holdings files. For a discretionary portfolio, ask for a complete holdings list.
Will selling to remove overlap trigger tax?
Not inside an ISA or SIPP. In a general investment account, gains above the £3,000 annual exempt amount are taxed at 18% or 24% for 2026 to 2027. Spreading sales over tax years and using bed-and-ISA can help.
Is a discretionary manager worth it if I also hold trackers?
That depends on what the manager does that your trackers do not. On Evelyn's published schedule, £750,000 costs about £9,450 a year before fund charges, so it is worth checking how much of that portfolio duplicates what you already own.
About Alpesh Patel OBE
Alpesh Patel OBE is Founding Principal of Rootbridge Capital, an author and Dealmaker for the UK Government's Department for Business. He is a former Visiting Fellow in Business, Corpus Christi College, Oxford University, where he worked on technology to improve financial education.
Sources
- State Street, SPDR S&P 500 ETF daily holdings, 18 November 2026 (opens in a new tab) and fund page (opens in a new tab)
- S&P Dow Jones Indices, S&P 500 (opens in a new tab)
- Statman, M. (1987), How Many Stocks Make a Diversified Portfolio? (opens in a new tab), Journal of Financial and Quantitative Analysis 22(3)
- Evelyn Partners, Discretionary Portfolio Service schedule of fees (opens in a new tab) and fees and charges (opens in a new tab)
- Hargreaves Lansdown, Fund and Share Account charges (opens in a new tab) and SIPP charges (opens in a new tab)
- Interactive Brokers UK, Stock commissions (opens in a new tab)
- GOV.UK, Individual Savings Accounts (opens in a new tab)
- GOV.UK, Capital Gains Tax rates and allowances (opens in a new tab)
- GOV.UK, Increasing Normal Minimum Pension Age (opens in a new tab)
- Alpesh Patel OBE, Too Many Funds in Your Portfolio (opens in a new tab) (YouTube)
Important: This article is for education only and is not personal financial advice or a recommendation to buy or sell any investment. This article is general investment education only and is not regulated investment advice. The value of investments can go down as well as up, and you may get back less than you invest. Past performance is not a reliable indicator of future results.
Important: this article is education and information only. It is not financial advice or a personal recommendation, and it does not take your circumstances into account. The value of investments and pensions can fall as well as rise, and you may get back less than you put in. Past performance is not a reliable indicator of future results. Figures were correct when the article was written and may have changed. If you are unsure what is right for you, speak to a regulated financial adviser.